Top Performers
ChemAnalyst has conducted a comprehensive analysis and ranking of companies based on their performance, considering key indicators such as net income, operating income, total assets, capital expenditures (Capex), and research and development (R&D) expenses in 2024 compared to 2023.
The performance of the leading chemical companies in 2024 has been marked by significant financial outcomes, driven by varying factors across different market conditions and geographies. Here, we delve into the financial performance of some of the top chemical companies, shedding light on their net income, key achievements, and challenges faced during the year.
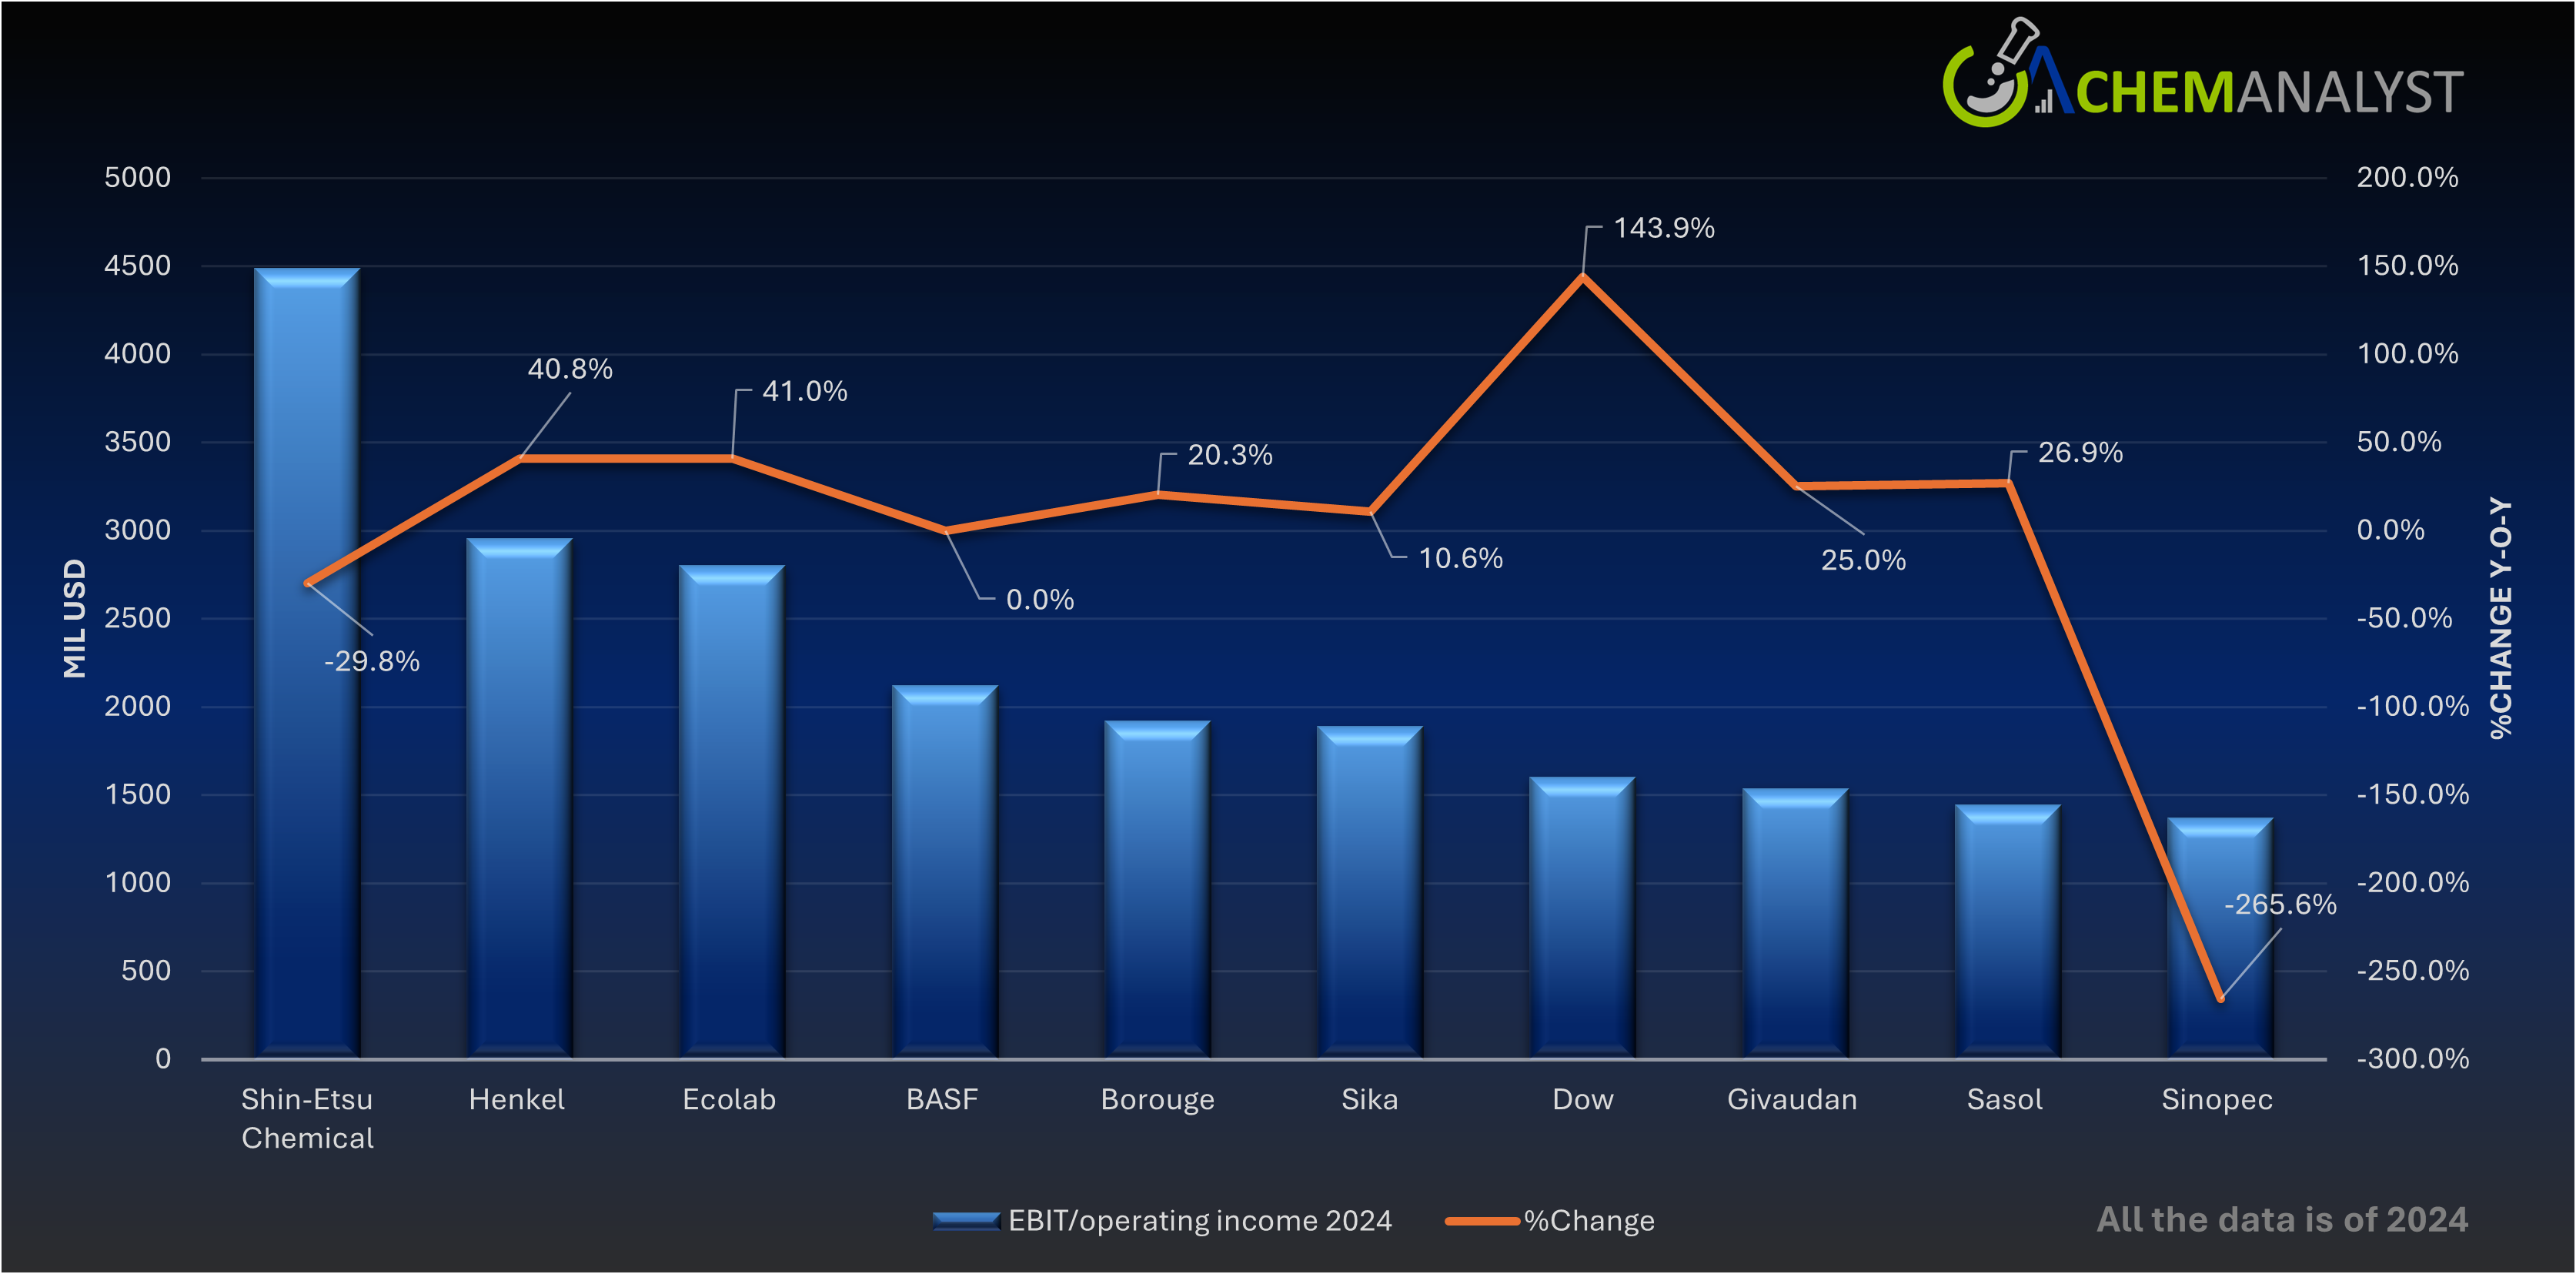
Top 10 By Operating Income/EBIT 2024
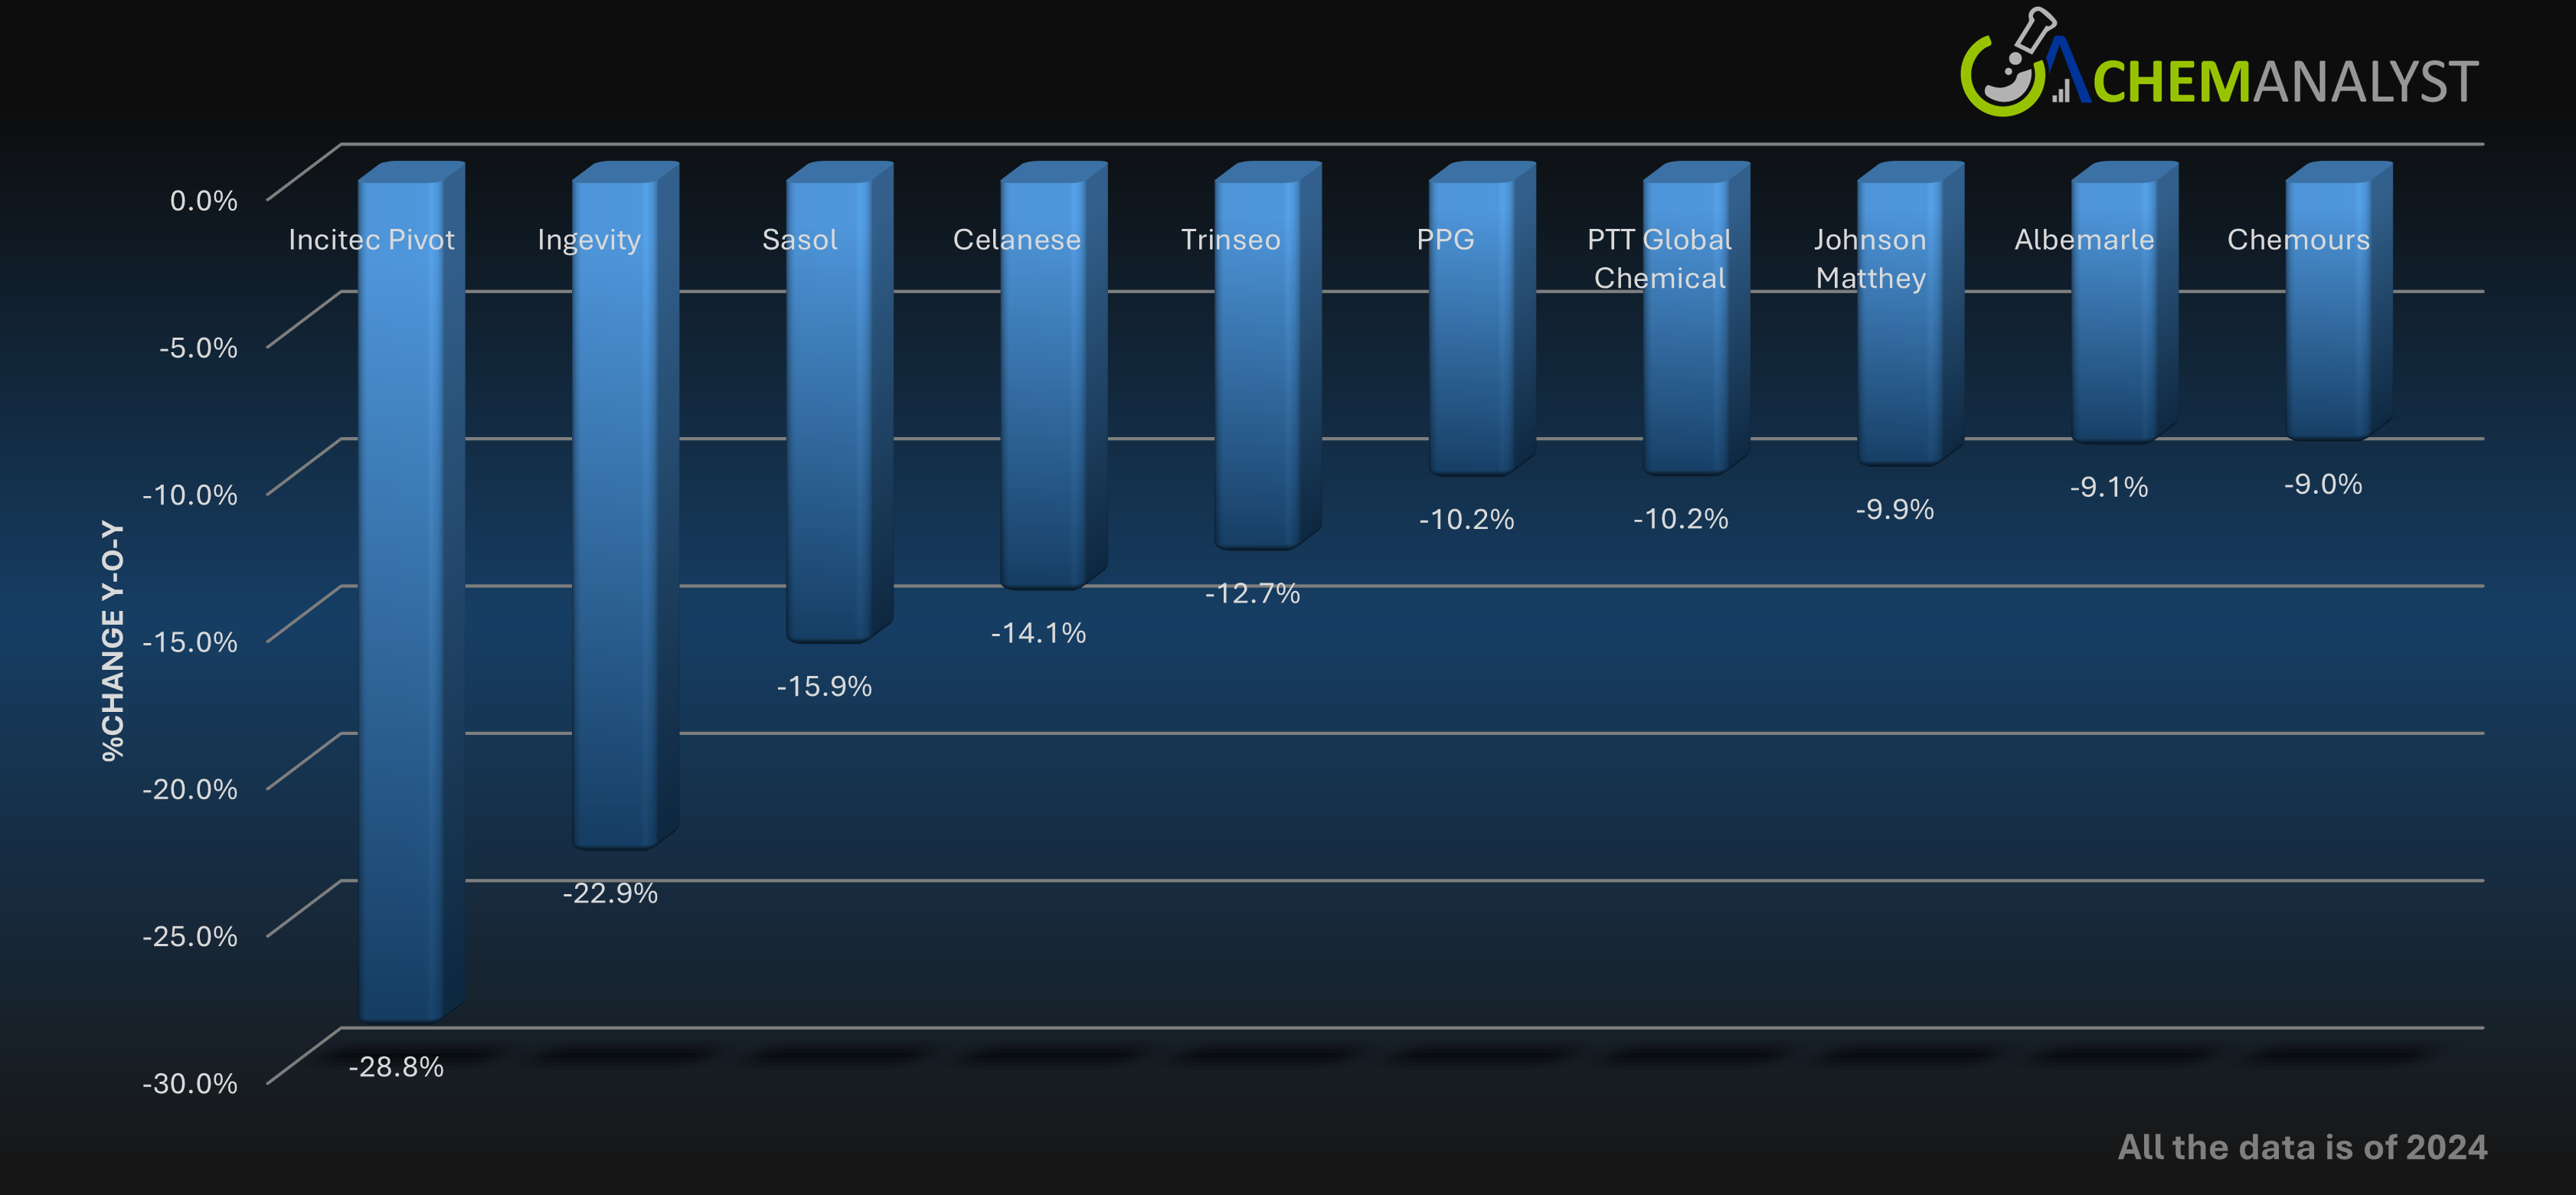
In 2024, Albemarle Corporation experienced a significant decline in net sales, falling to $5,377.5 million, a 44% drop from the previous year. The company reported a net loss of $1,135.5 million, reversing its net income of $1,573.5 million in 2023. This downturn was largely driven by a 53% decrease in lithium prices, a result of global oversupply, reduced electric vehicle adoption, and heightened competition from Chinese producers. Additional impacts came from restructuring charges and asset write-offs. Despite these challenges, Albemarle achieved adjusted EBITDA of $1,139.8 million by implementing cost improvements and growing volumes in other segments. To navigate the difficult market conditions, the company executed cost-cutting measures, including workforce reductions and capital expenditure cuts, while optimizing its conversion network to bolster financial flexibility.
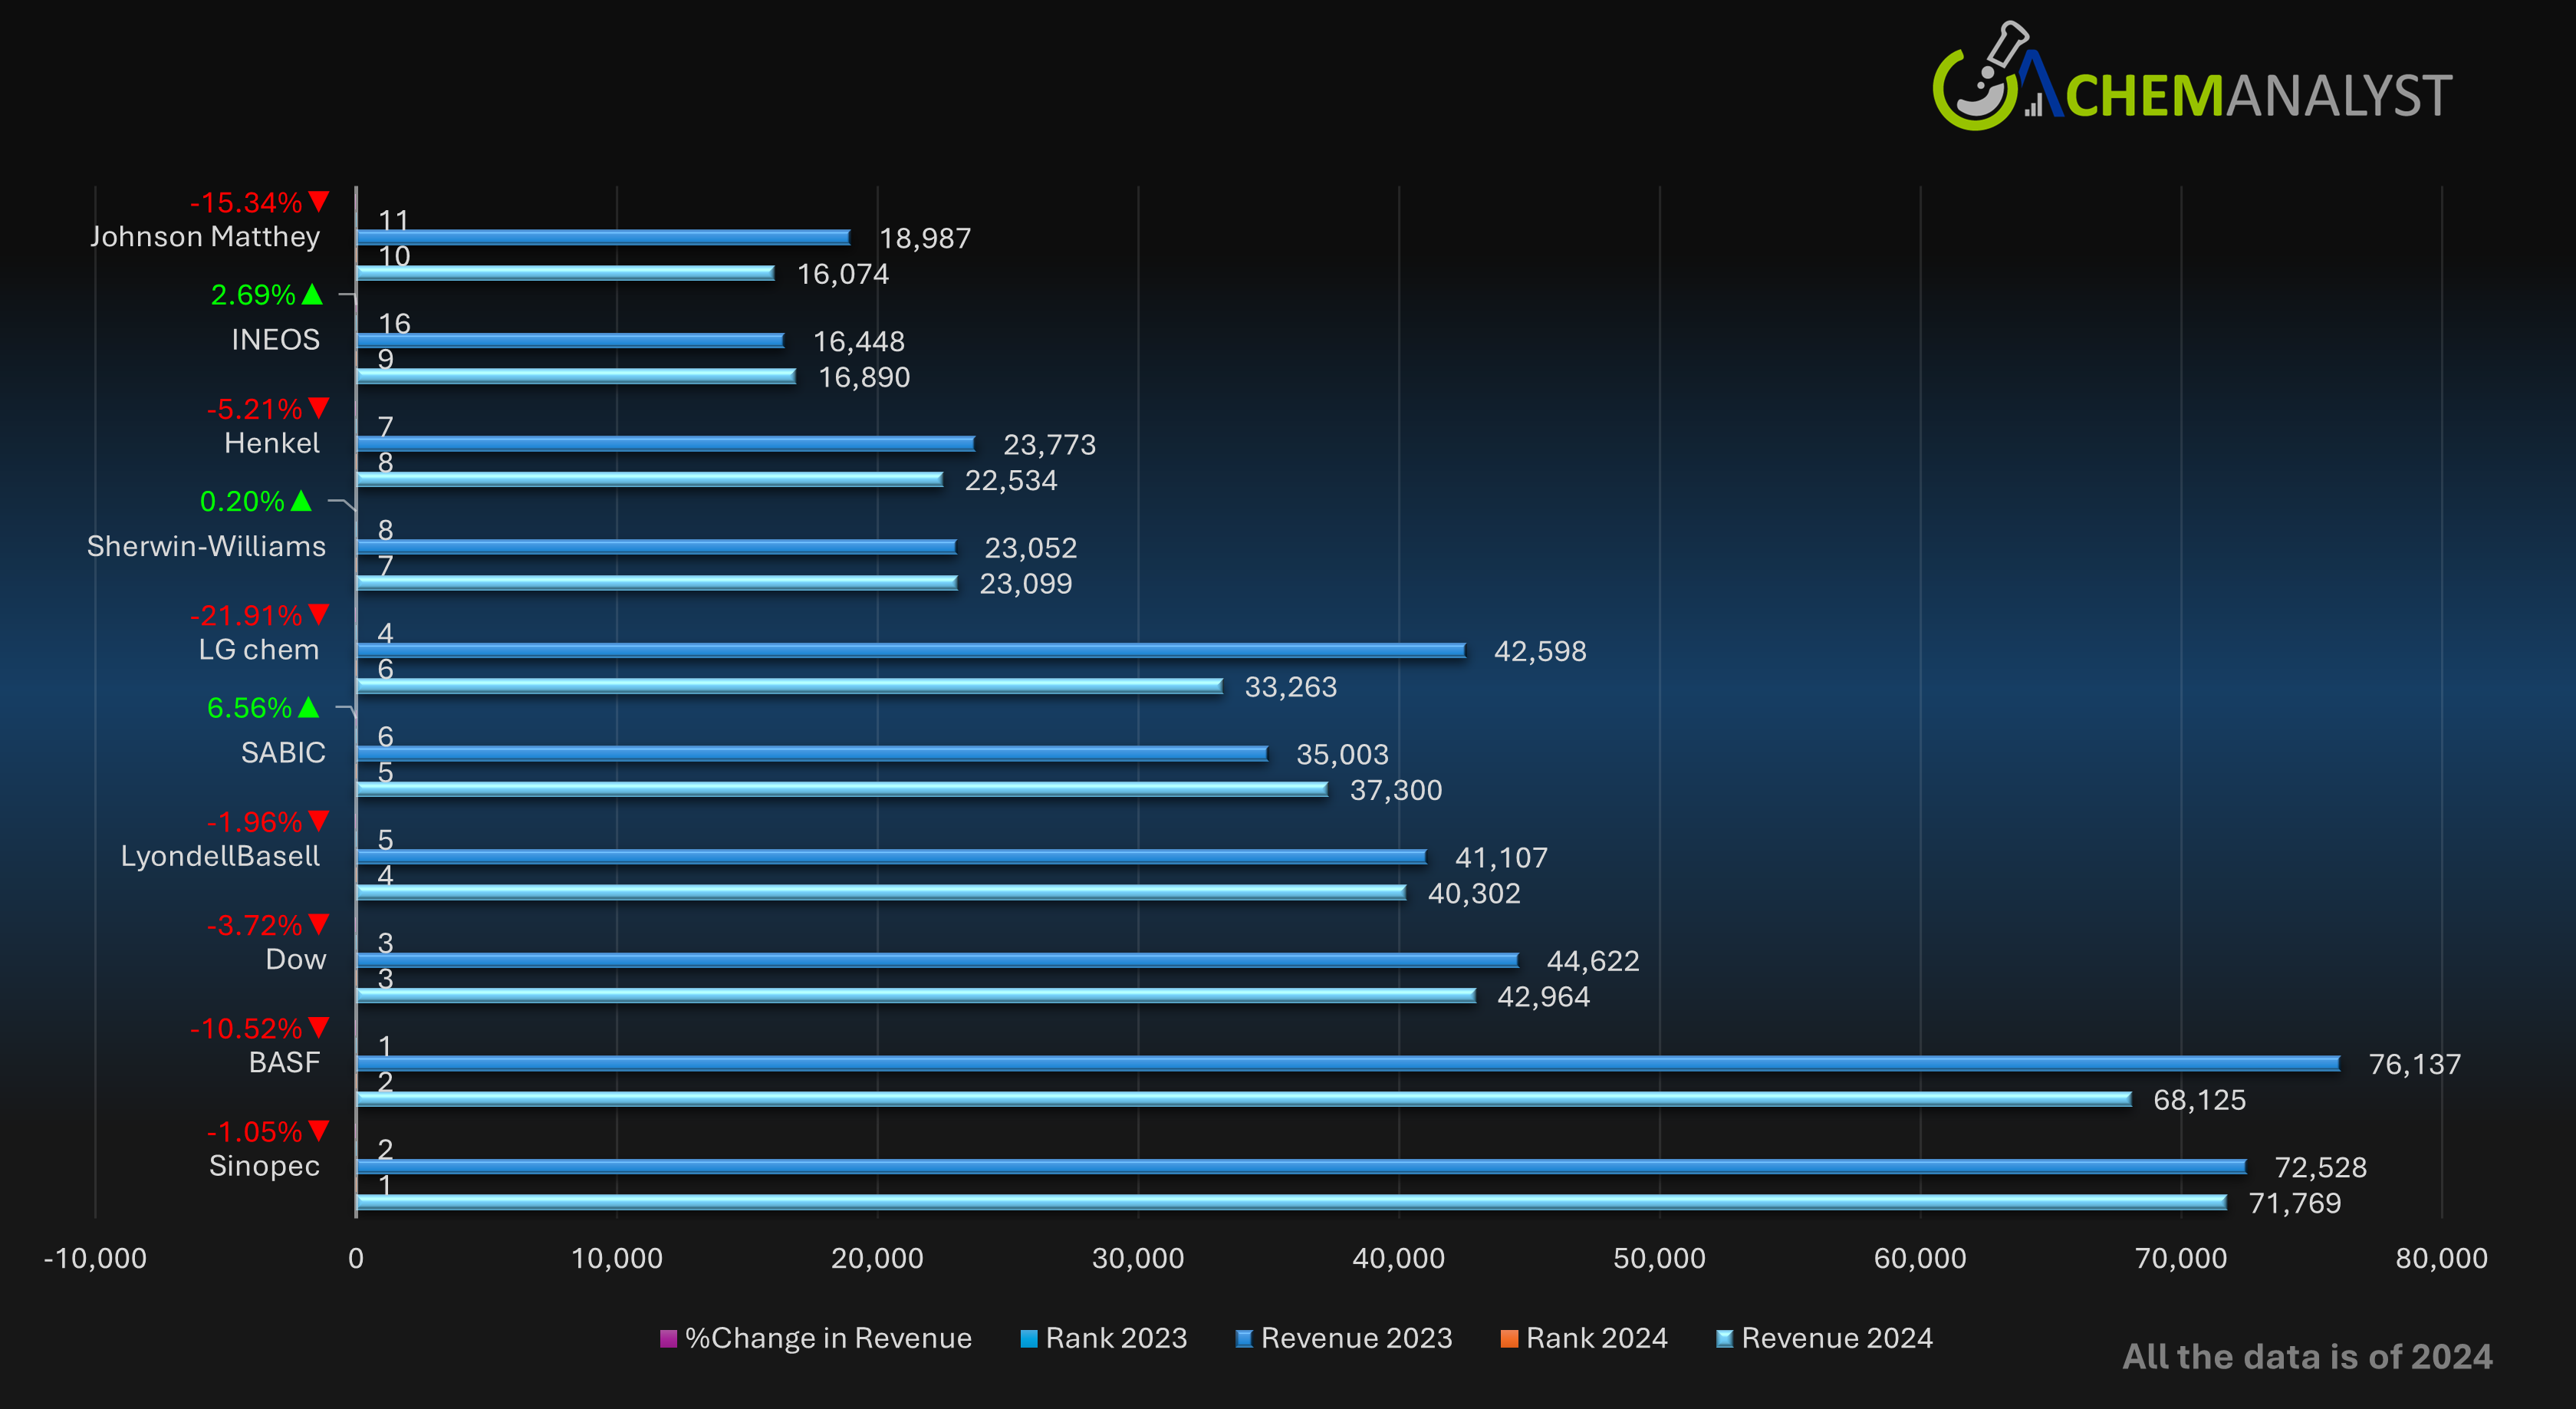
In 2024, INEOS Group Holdings reported revenues of approximately $17.6 billion, marking an 8.6% increase from $16.2 billion in 2023. Despite an operating profit increase to $1.21 billion (from €1.11 billion), the company faced a pre-tax loss of $77.5 million due to substantial debt-related finance costs exceeding $1.2 billion. This financial strain led to the suspension of annual dividends; a move supported by major shareholders to reinvest in the business. INEOS's challenges were compounded by a global oversupply in the petrochemical sector, reduced demand in Asia, and the impact of U.S. trade tariffs. Additionally, unforeseen events like a hurricane-induced shutdown in Texas and an unscheduled outage at the Lavera cracker in France affected operations. To navigate these challenges, INEOS focused on strategic acquisitions, including assets from LyondellBasell and TotalEnergies, and emphasized cash management and liquidity, maintaining cash balances of approximately $2.4 billion by the end of September 2024.
In 2024, LG Chem posted consolidated revenues of approximately $33.9 billion USD (₩48.92 trillion), reflecting an 11.5% decline from the previous year, amid prolonged global petrochemical oversupply and weakened demand in China. Net income plummeted by 74.9% to around $351 million USD, while operating profit dropped 63.8% to $636 million USD. The sharp downturn was driven by a sluggish electric vehicle market impacting battery material sales and margin pressure in core petrochemical segments. In response, LG Chem ramped up its portfolio transformation, prioritizing high-value growth areas like sustainable materials, advanced battery components, and biopharma innovation. Strategic capital expenditure cuts and business optimization efforts were key to maintaining operational resilience during a year of significant headwinds
In 2024, Wacker Chemie AG reported revenues of approximately $5.97 billion USD (€5.72 billion), marking an 11% decline from the previous year, primarily due to decreased prices and volumes in its polysilicon division. The company faced challenges such as high energy costs in Germany and subdued demand in key sectors like construction and automotive. Despite these hurdles, Wacker achieved an EBITDA of $801 million USD (€770 million), a 7% decrease year-over-year, and a net income of $271 million USD (€265 million), down 20%. Capital expenditure was reduced by 6% to $692 million USD (€665 million), focusing on capacity expansions across all business divisions. Total assets increased by 6.3% to $9.78 billion USD (€9.41 billion), while R&D expenses rose by 10.6% to $212 million USD (€203.7 million), underscoring the company's commitment to innovation amidst challenging market conditions.
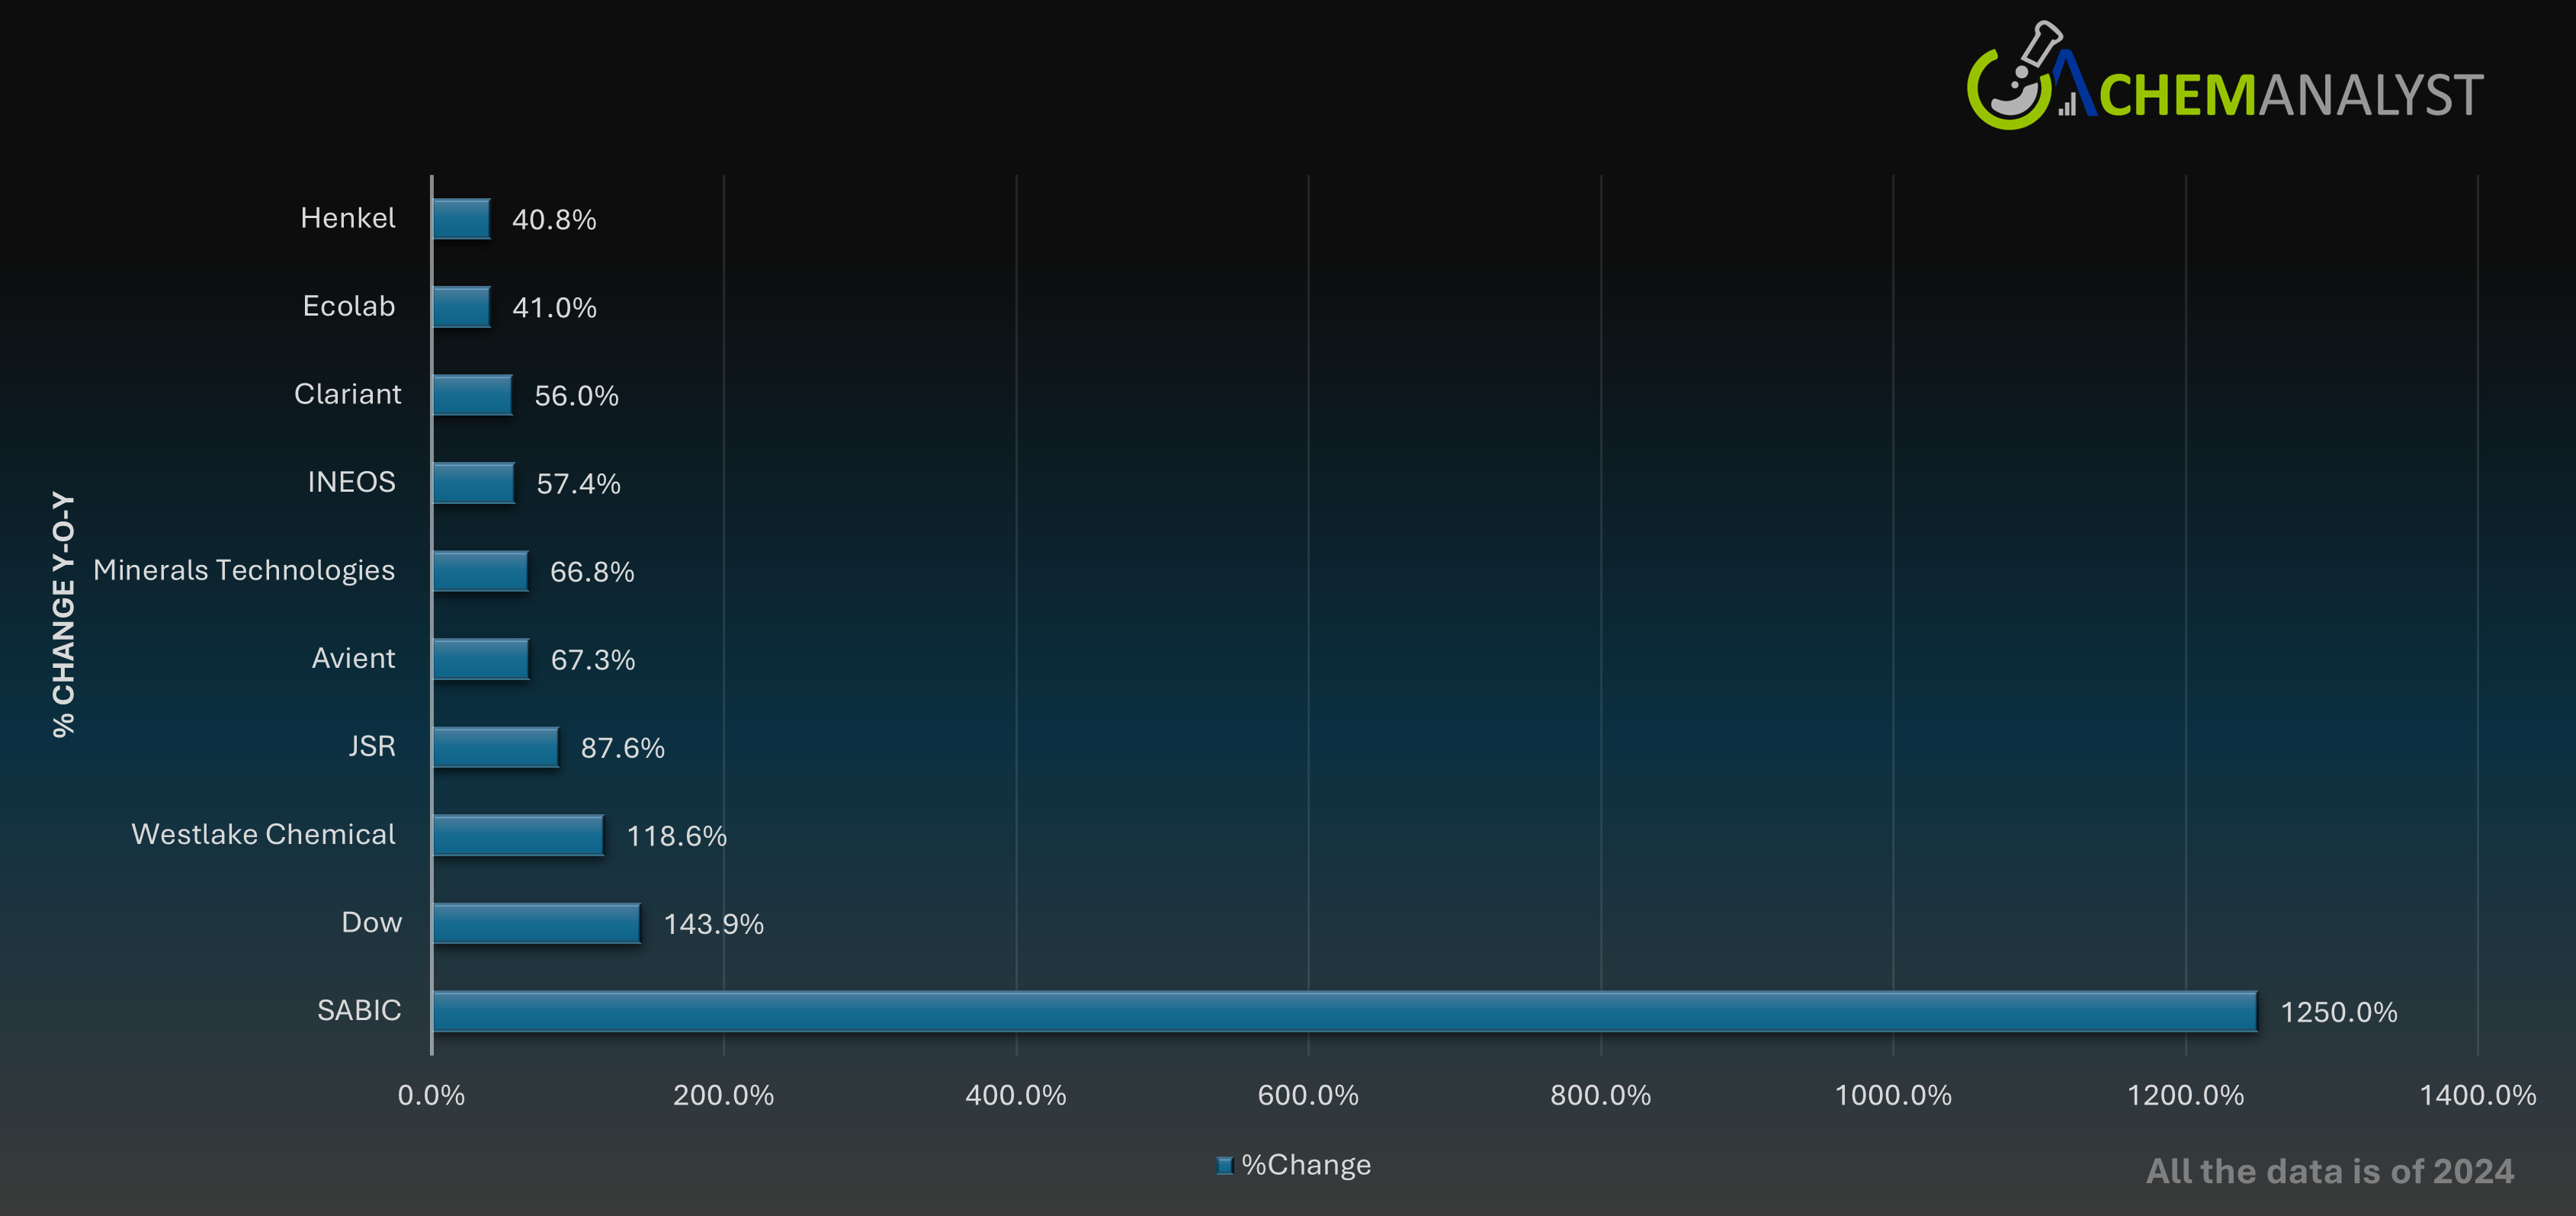
In 2024, SABIC’s Chemical segment—the company’s largest revenue driver—faced a significant financial decline amid a challenging global market. Annual revenue for the segment dropped by 22% to SAR 102.3 billion from SAR 130.6 billion in 2023, primarily due to weaker demand and lower average selling prices across key product categories such as olefins, aromatics, and polyolefins. The segment's earnings before interest and taxes (EBIT) turned negative, posting a loss of SAR 1.0 billion in Q1 2024 compared to a profit of SAR 0.3 billion in Q1 2023. Correspondingly, the EBIT margin deteriorated to -4.6% from +1.1% year-on-year. Total segment assets also declined to SAR 206.8 billion from SAR 212.7 billion over the same period. Despite margin compression and headwinds from feedstock cost pressures and global overcapacity, SABIC continued to prioritize operational efficiency, innovation, and sustainability within its Chemical business to reinforce long-term resilience.