top 100 Pharma Companies ranking, 2024

Values in USD Billion

Ranking Companies Net Sales 2023/Revenue % Change (from 2022) Business Operating income 2023 % Change (from 2022) Net Income/Profit % Change (from 2022) Total Assets % Change (from 2022) Capital expenditures (CapEx) 2023 % Change (from 2022) R&D expenses 2023 % Change (from 2022) EBITDA % Change (from 2022) PHARMA Revenue/sales
1 Janssen/Johnson Johnson [1] 85.16 6.46% 15.06 -22.20% 35.15 95.94% 167.56 -10.58% 0.88 -92.90% 15.09 6.72% NA NA -
2 Roche [1] 65.37 -7.21% 21.42 -13.23% 13.76 -8.67% 100.72 2.63% 13.25 139.28% 14.74 -0.14% 24.47 -12.15% 51.53
3 Merck [1] 60.12 1.40% 1.89 -88.51% 0.37 -97.49% 32.17 -9.95% 41.32 4.85% 30.53 125.35% NA NA 53.58
4 Pfizer [1] 58.50 -41.70% 2.17 -93.08% 2.12 -93.25% 226.50 14.86% 18.94 16.38% 10.68 -6.55% NA NA 50.91
5 AbbVie [1] 54.32 -6.44% 12.76 -29.59% 4.86 -58.91% 134.71 -2.95% 0.78 11.80% 7.68 17.90% NA NA -
6 Bayer [1] 51.52 -6.11% 0.66 -91.27% 3.18 -29.13% 125.74 -6.90% 3.60 -8.49% 5.81 -18.27% 11.50 -21.33% 19.56
7 Sanofi [1] 46.58 0.17% 8.52 -26.10% 5.88 -35.93% 136.78 -0.20% 10.99 2.95% 7.28 0.33% NA NA -
8 AstraZeneca [1] 45.81 3.29% 8.19 118.07% 5.96 81.11% 101.12 4.80% 1.37 172.51% 10.94 12.02% 13.58 47.02% 1.33
9 Novartis [1] 45.44 7.66% 9.77 22.94% 14.85 113.57% 99.95 -14.91% 9.51 564.85% 11.37 23.98% 18.71 14.26% -
10 Bristol-Myers Squibb [1] 45.01 -2.50% 8.44 9.43% 8.04 26.71% 95.16 -1.72% 6.65 6.25% 9.30 -2.21% NA NA 73.68
11 Abbott EPD [1] 40.11 -8.12% 6.48 -22.53% 5.72 -17.45% 73.21 -1.64% 2.20 23.92% 2.74 -5.09% NA NA -
12 Shanghai Pharma Mfg [1] 36.78 12.21% 1.08 -99.91% 0.73 -99.93% 29.95 -99.89% 0.45 -99.89% 0.31 -99.90% NA NA 32.35
13 CR Pharma Segment [1] 34.57 12.16% 1.40 18.17% 1.10 16.78% 25.23 17.28% 0.44 14.33% 0.29 14.25% NA NA 6.14
14 Eli Lilly [1] 34.12 19.56% 6.55 -3.70% 5.24 -16.08% 64.01 29.33% 3.45 86.36% 9.31 29.52% NA NA -
15 Novo Nordisk [1] 33.71 31.26% 14.89 37.11% 12.15 50.71% 45.65 30.35% 3.75 112.47% 4.71 34.91% 16.26 36.29% -
16 GlaxoSmithKine (GSK) [1] 32.80 3.42% 7.30 4.85% 5.74 -66.02% 63.82 -1.90% 9.76 0.97% 6.73 13.39% NA NA -
17 Takeda [3] 30.42 5.87% 1.53 -56.36% 1.03 -54.51% 107.79 8.25% 3.43 -24.14% 5.21 15.25% 9.42 14.67% -
18 Amgen [1] 28.19 7.09% 7.90 -17.45% 6.72 2.52% 97.15 49.19% 1.10 17.52% 4.78 7.89% NA NA 26.91
19 Boehringer Ingelheim [1] 27.70 6.05% NA NA NA NA NA NA NA NA 6.24 14.25% NA NA -
20 Gilead [1] 27.12 -0.60% 7.61 3.75% 5.61 22.93% 62.13 -1.66% 0.59 -19.64% 5.72 14.89% NA NA 26.93
21 Fresenius Kabi [1] 24.12 3.56% 1.24 -36.92% 1.84 -19.70% 48.98 -40.73% 1.20 1.65% 0.71 3.44% 3.70 3.23% 18.65
22 Teva [1] 15.85 6.17% 0.43 -80.29% 0.56 -76.24% 43.48 -1.21% 0.53 -4.01% 0.95 13.72% NA NA -
23 Viatris [1] 15.43 -5.14% 0.77 -52.55% 0.05 -97.37% 47.69 -4.67% 0.38 -7.14% 0.81 21.59% 5.12 -11.30% 15.39
24 Baxter Pharma [1] 14.81 2.12% 0.39 -82.61% 2.66 10.00% 28.28 -0.04% 0.69 11.61% 0.67 10.80% NA NA 9.84
25 CSL [4] 13.31 26.02% 3.07 4.84% 2.24 -0.47% 36.23 27.83% 1.69 35.61% 1.24 6.82% 3.90 8.46% -
26 Regeneron [1] 13.12 7.76% 4.05 -14.60% 3.95 -8.87% 33.08 13.23% 0.72 21.78% 4.44 23.56% NA NA 7.08
27 Astellas [3] 11.44 5.60% 0.18 -80.82% 0.12 -82.73% 25.47 45.31% 0.27 4.43% 2.10 6.54% NA NA -
28 Daiichi Sankyo [3] 11.43 25.28% 1.51 75.48% 1.43 84.10% 24.69 37.95% 0.63 NA 2.61 6.91% NA NA -
29 Vertex Pharma [1] 9.87 10.51% 3.83 -11.04% 3.62 8.96% 22.73 25.23% NA NA 3.16 24.51% NA NA -
30 Biogen [1] 9.84 -3.32% 1.30 -63.90% 1.16 -61.89% 26.84 9.33% 0.28 15.27% 2.46 10.35% NA NA 7.25
31 Bausch Health [1] 8.76 7.79% 0.96 112.11% 0.61 171.56% NA NA NA NA 0.60 14.18% 2.18 -19.85% -
32 Zoetis [1] 8.54 5.74% NA NA 2.34 10.88% NA NA 0.73 24.91% 0.61 13.91% NA NA NA
33 Chugai [1] 7.93 -11.78% 3.13 -17.65% 2.32 -13.08% 13.79 3.36% 2.92 9.22% 1.25 16.87% NA NA 6.95
34 Zhifei Bio [1] 7.48 38.30% NA NA 1.12 5.40% 7.10 32.18% NA NA 0.14 13.38% NA NA 0.0039
35 Grifols [1] 7.13 8.71% 0.86 -0.78% 0.20 -33.37% 23.07 -0.97% 0.23 -21.36% 0.43 9.45% 1.37 3.60% -
36 Otsuka [1] 6.97 13.51% 0.45 14.96% 0.34 18.71% 4.01 7.42% 0.03 219.46% 0.01 30.50% NA NA -
37 Moderna [1] 6.85 -64.45% 4.24 -55.00% 4.71 -43.63% 18.43 -28.74% 0.71 76.75% 4.85 47.04% NA NA 6.67
38 Fosun Pharma [1] 5.83 -5.85% 0.46 -28.46% 0.41 -28.42% 11.26 7.94% 0.81 -0.73% 0.61 1.02% 1.09 -3.99% 4.25
39 Servier [5] 5.76 9.25% 0.57 19.68% 0.67 224.48% NA NA NA NA NA NA 1.10 18.16% -
40 UCB [1] 5.68 -4.80% 0.65 3.25% 0.37 -17.94% 16.81 -2.07% 0.34 -14.82% 1.76 -2.40% 1.46 7.06% 5.26
41 Sun Pharma [2] 5.39 12.49% 1.14 109.95% 1.03 158.92% 9.78 15.67% 0.25 39.50% 0.29 6.68% 1.40 14.85% 5.24
42 Eisai [3] 5.29 -0.36% 0.38 33.39% 0.31 -22.96% 9.94 10.33% 0.18 -28.17% 1.21 -2.30% NA NA -
43 Menarini [1] 4.73 NA NA NA NA NA NA NA NA NA NA NA NA NA 4.54
44 CSPC Pharma [1] 4.44 1.66% 1.04 -2.54% 0.86 -2.56% 3.78 11.64% 0.15 -35.44% 0.68 21.17% NA NA -
45 Elanco [1] 4.42 0.14% 1.20 1559.72% 1.23 1478.21% 14.36 -7.29% 0.14 -18.13% 0.33 1.87% 0.98 15.04% 1.93
46 BioNTech [1] 4.13 -77.94% 0.75 -94.54% 1.01 -90.14% 24.88 -1.17% 0.76 94.00% 1.93 16.01% NA NA 0.65
47 Galderma [1] 4.08 8.56% NA NA NA NA NA NA NA NA NA NA 0.81 2.15% -
48 STADA [1] 4.04 13.25% 0.63 38.24% 0.08 -79.41% 5.66 -9.00% 0.28 17.59% 0.10 13.96% 0.87 18.14% 2.15
49 Jazz Pharma [1] 3.83 4.78% 0.58 782.95% 0.41 85.14% 11.39 5.15% 0.20 -9.33% 0.85 43.90% NA NA 3.74
50 Sino Biopharma [1] 3.70 0.67% 0.76 3.74% 0.72 1.89% 8.99 -0.72% 0.37 50.17% 0.62 5.73% NA NA -
51 Incyte [1] 3.70 8.87% 0.62 7.09% 0.60 75.42% 6.78 16.11% 0.03 -58.24% 1.63 2.63% NA NA -
52 Ono [3] 3.59 12.41% 1.14 12.66% 0.91 13.40% 6.52 3.54% 0.13 3.43% 0.80 17.65% NA NA 0.91
53 Octapharma [1] 3.53 14.43% 0.47 -16.35% 0.38 -20.93% 5.11 4.97% 0.25 11.07% 0.10 22.85% NA NA -
54 Ipsen [1] 3.38 3.39% 1.08 -10.26% 0.83 -12.25% NA NA NA NA 0.67 39.01% NA NA -
55 Chiesi [1] 3.27 10.08% NA NA NA NA NA NA NA NA NA NA 0.97 -99.89% NA
56 Hengrui Medicine [1] 3.22 7.26% NA NA NA NA NA NA NA NA 0.87 -3.09% NA NA -
57 Kyowa Kirin [1] 3.15 11.01% 0.69 11.64% 0.58 51.55% 7.32 9.16% 0.23 3.53% 0.51 14.64% 0.85 37.23% NA
58 Pierre Fabre [1] 3.06 4.81% NA NA NA NA NA NA NA NA 0.21 11.11% NA NA -
59 Aurobindo [2] 3.01 5.97% 0.32 -22.54% 0.23 -27.18% 4.83 17.59% 0.01 -19.67% 0.17 -10.74% 0.46 -14.33% -
60 Dr. Reddy's [2] 2.98 14.69% 0.69 93.87% 0.55 91.22% 3.91 8.83% NA NA 0.23 10.86% 0.88 42.18% 2.84
61 Shionogi [3] 2.93 -3.89% 1.09 2.89% 1.15 -12.97% 10.11 8.01% 0.27 31.56% 0.73 0.24% 1.35 NA 0
62 Lundbeck [1] 2.89 9.13% 0.46 12.03% 0.33 19.52% 5.43 -0.12% NA NA 0.50 -7.91% 0.76 11.67% -
63 Hikma [1] 2.88 14.22% 0.37 30.14% 0.19 0.52% 4.68 4.67% 0.20 -9.33% 0.15 3.47% NA NA 1.485
64 Cipla [2] 2.76 4.55% 0.49 15.60% 0.34 11.24% 3.57 8.72% 0.14 68.71% 0.16 19.63% 0.61 9.81% 2.72
65 BeiGene [1] 2.46 73.65% 1.21 -32.52% 0.88 -56.00% 5.81 -9.00% 0.56 72.68% 1.78 8.42% NA NA 0.38
66 BioMarin [1] 2.42 15.42% 0.16 5.71% 0.17 18.43% 6.84 7.32% 0.11 -18.19% 0.75 14.96% NA NA 2.37
67 Genmab [1] 2.39 13.57% 0.77 -15.09% 0.63 -20.18% 5.12 17.17% 0.05 15.46% 1.11 37.18% NA NA 0.11
68 Ferring [1] 2.38 -3.53% 0.15 -39.66% 0.13 -32.60% 4.41 29.26% 0.08 -33.68% 0.38 0.71% 0.44 11.91% 2.34
69 Royalty Pharma [1] 2.35 5.25% 1.49 385.94% 1.13 2549.50% 0.18 -0.78% NA NA 0.05 -70.62% 2.81 9.34% -
70 Recordati [1] 2.25 12.36% 0.60 27.60% 0.42 24.61% 4.55 5.23% 0.41 297.83% 0.28 16.19% 0.83 14.40% 2.19
71 Dainippon Sumitomo [3] 2.24 -43.38% 2.53 360.98% 2.25 225.63% 6.47 -20.03% 0.24 -52.54% 0.80 -14.58% NA NA 2.23
72 Santen [3] 2.15 8.24% 0.27 -98.75% 0.19 -99.82% 3.11 -99.90% 0.19 -99.88% 0.18 -99.91% 0.50 -99.86% 0.88
73 Sobi [1] 2.09 17.74% 0.38 6.64% 0.23 -8.68% 6.98 41.01% NA NA 0.26 18.78% 0.67 13.55% 2.55
74 Lupin [2] 2.02 1.01% 0.09 -47.79% 0.05 -70.34% 2.78 5.20% 0.18 65.69% 0.15 -8.73% 0.23 -18.89% 2.02
75 Endo International[1] 2.01 -13.25% 2.45 -15.87% 2.45 -16.19% 5.14 -10.78% 0.09 -5.41% 0.12 -9.82% 2.09 NA 0.86
76 Grünenthal [1] 1.97 9.98% 0.13 -39.41% 1.29 -74.63% NA NA NA NA 0.18 -1.22% 0.46 -2.51% 0.68
77 Unilab [1] 1.94 21.20% 0.47 66.60% 0.38 70.83% 1.95 10.17% 0.14 178.07% 1.14 36.20% 0.56 50.60% NA
78 Neurocrine [1] 1.89 26.76% 0.25 0.76% 0.25 61.62% 3.25 37.27% 0.03 71.52% 0.57 21.82% NA NA 1.86
79 Exelixis [1] 1.83 13.60% 0.17 -15.19% 0.21 13.98% 2.94 -4.20% 0.04 46.07% 1.04 17.07% NA NA 1.63
80 Alnylam [1] 1.83 76.23% 0.28 -64.06% 0.44 -61.08% 3.83 7.99% 0.06 -13.73% 1.00 13.75% NA NA 1.24
81 Celltrion [1] 1.67 -4.71% 0.50 0.66% 0.41 -0.53% 15.26 235.74% NA NA 0.12 15.32% NA NA -
82 LEO Pharma [1] 1.65 7.06% 0.25 -48.69% 0.52 -12.24% 3.04 -8.64% 1.54 -14.14% 0.27 -24.25% 0.08 -71.84% 0.62
83 Kedrion [1] 1.55 182.73% 0.04 -72.77% 0.00 -91.36% 3.42 -1.84% NA NA 0.04 275.16% 0.20 7.17% 1
84 Hansoh Pharma [1] 1.43 7.69% 0.53 27.73% 0.46 26.85% 4.08 11.81% 0.05 9.09% 0.30 23.84% NA NA 0.97
85 Biocon [2] 1.40 37.56% 0.11 -8.75% 0.08 -16.67% 6.30 155.19% 0.21 -10.31% 0.14 88.13% 0.46 74.38% -
86 Angelini [1] 1.30 398.34% NA NA NA NA NA NA NA NA NA NA NA NA NA
87 Orion [1] 1.29 -11.26% 0.30 -37.47% 0.23 -37.97% 1.56 -4.32% 0.10 -15.42% 0.14 -4.73% 0.35 -32.99% 0.58
88 argenx [1] 1.27 184.91% 0.43 -40.99% 0.30 -58.42% 4.54 44.93% 0.04 -57.80% 0.86 29.57% NA NA 1.2
89 Sarepta Therapeutics [1] 1.24 33.26% 0.27 -50.05% 0.54 -23.81% 3.26 4.35% NA NA 0.88 0.03% NA NA 1.14
90 Torrent Pharma [2] 1.17 11.04% 0.22 50.68% 0.15 60.22% 1.82 14.60% 0.07 183.33% 0.06 0.00% 0.35 9.58% 1.16
91 Tianjin Pharma[1] 1.162 -0.33% 0.15 12% 0.14 11% 1.45 1% NA NA 0.03 21% NA NA 0.66
92 Emergent BioSolutions [1] 1.05 -6.10% 0.73 327.29% 0.76 259.40% 1.82 -42.42% 0.05 -55.44% 0.11 -40.84% NA NA 0.94
93 Innovent Biologics [1] 0.88 36.21% 0.16 -47.27% 0.15 -52.83% 1.77 16.75% NA NA 0.31 -22.42% 0.08 -72.98% 0.81
94 Ionis [1] 0.79 34.10% 0.35 -13.76% 0.37 35.80% 2.99 18.00% NA NA 0.90 7.98% NA NA 0.31
95 Gan Lee Pharma [1] 0.37 52.31% 0.10 71.86% 0.05 -22.63% 1.66 10.45% NA NA 0.07 -10.92% NA NA -
96 Ascendis Pharma [1] 0.29 421.20% 0.49 -18.92% 0.52 -17.45% 0.89 -24.24% 0.00 -83.15% 0.45 8.91% NA NA 0.05
97 SK Biopharma [1] 0.27 44.16% 0.03 -71.37% 0.03 -63.19% 0.55 8.87% NA NA 0.50 1.82% NA NA NA
98 Roivant Sciences [2] 0.06 10.84% 1.18 -13.05% 1.01 19.37% 2.39 -7.56% 0.01 -27.22% 0.53 8.73% NA NA 0.03
99 CureVac [1] 0.06 -20.24% 0.31 16.72% 0.30 11.30% 0.85 -8.39% 0.06 -43.11% 0.13 85.01% NA NA 0.15
100 CanSino Biologics [1] 0.05 -66.52% 0.29 48.69% 0.28 103.93% 1.32 -18.75% 0.04 -42.32% 0.09 -18.02% NA NA 0.17

  • [1] FY23 Ending December 31' 23
  • [2] FY23 Ending March 31' 23
  • [3] FY23 Ending March 31' 24
  • [4] FY23 Ending 30 June ' 23
  • [5] FY23 Ending 30 September ' 23
  • [-] Net sales is equlivalent to net pharmaceutical sales

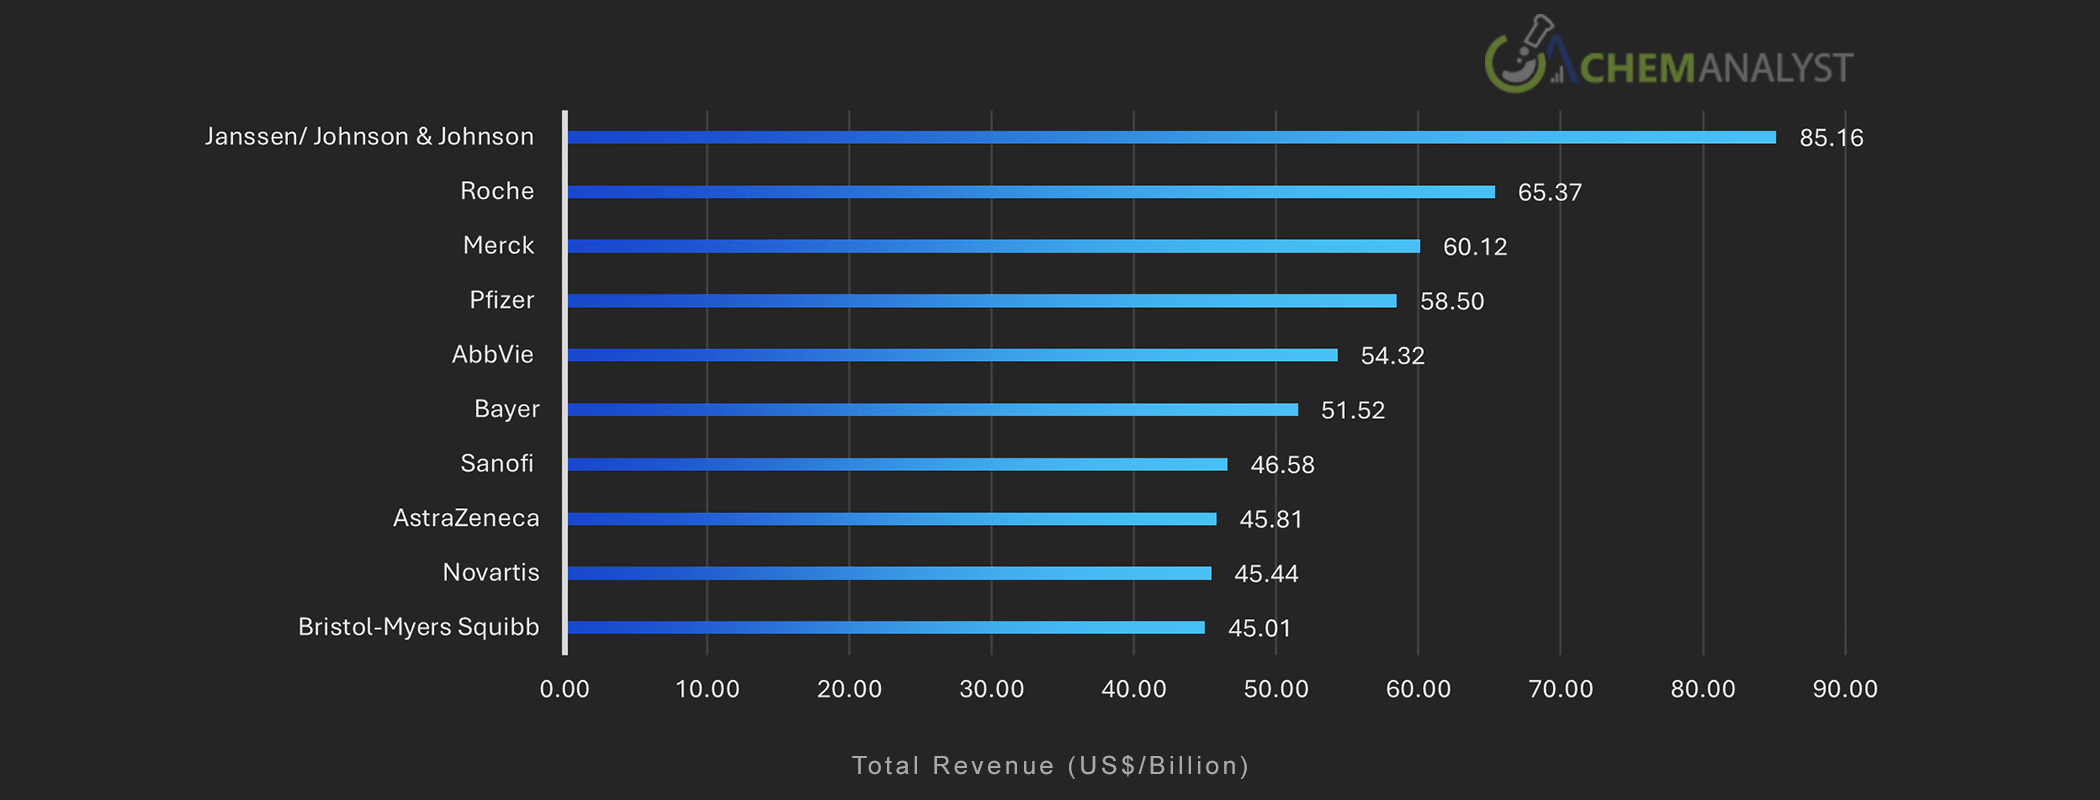
In the face of global challenges, including wars and global emergencies impacting market dynamics, the pharmaceutical industry continues to be the foremost example of a sector that operates around the clock. In 2023, the pharmaceutical market worldwide remained at the center of public and medical focus, driven by both the aftermath of the COVID-19 pandemic and the emergence of new health challenges. The pandemic underscored the medical sector's vital role in global health and accelerated trends such as drug development, enhanced R&D, digital transformation, and personalized medicine. Leading pharmaceutical companies like Johnson & Johnson, merck, and Roche were highlighted for their ongoing advancements in drugs and treatments, demonstrating the industry's capacity for rapid innovation and resource mobilization in times of urgent need.

In 2023, the industry also made significant strides in other therapeutic areas, with substantial investments in R&D for oncology, immunology, and cardiovascular diseases. Emerging markets, including China and India, continued to grow in importance as significant manufacturing hubs and expanding markets for pharmaceutical products. These nations have been heavily investing in biotechnology and pharmaceutical R&D, despite facing challenges related to intellectual property rights and regulatory compliance.

Digitization remained a key trend shaping the industry. Pharmaceutical companies increasingly leveraged data analytics and artificial intelligence for drug discovery, clinical trials, and market research, helping to shorten the drug development cycle and reduce costs. However, the industry faced its fair share of challenges. Regulatory scrutiny of drug safety and effectiveness grew globally. The impending "patent cliff," where many popular drugs will lose patent protection, posed a serious threat to revenue streams. Additionally, governments and advocacy organizations increased pressure for more transparent pricing structures and easier access to essential medications.

In conclusion, the pharmaceutical sector in 2023 was characterized by rapid advancements and significant challenges, reflecting its resilience, innovation, and crucial role in addressing global health issues.

Therefore, by comparing the financial performance of the global pharmaceutical market in 2023 to 2022, ChemAnalyst aims to highlight the impact of market uncertainties and challenges on this industry through this study.

Top Performers

ChemAnalyst has conducted a comprehensive analysis and ranking of companies based on their performance, considering key indicators such as Revenue, Business Operating Income, Net Income, Total assets, and R&D expenditure in 2023 compared to 2022.

Top 10 Companies by Revenue

Top 10 Companies by Revenue

In the year 2023, the pharmaceutical industry experienced notable shifts in revenue among its leading companies, reflecting diverse market dynamics and strategic adjustments. Johnson & Johnson’s pharmaceutical segment, Janssen, led the market with an impressive revenue of $85.16 billion, marking around 6.5% increase from 2022. This growth was driven by robust sales in their immunology and oncology products, alongside strategic acquisitions. Roche, however, faced a revenue decline of 7.21%, bringing in $65.37 billion. The decrease was primarily due to challenges in their oncology portfolio and increased competition in the biosimilars market, though they remain significant in diagnostics and personalized healthcare. Merck saw a modest growth of 1.40%, reaching $60.12 billion, fueled by strong performance in their oncology and vaccine segments and continued investment in R&D.

Conversely, Pfizer experienced a substantial revenue drop of more than 40%, resulting in $58.50 billion, mainly due to reduced demand for COVID-19 vaccines and treatments that had previously boosted their earnings. Despite this, Pfizer's core business remains robust with a focus on innovative medicines. AbbVie’s revenue fell by 6.44% to $54.32 billion, impacted by the loss of exclusivity for Humira in several markets, although their other immunology and oncology products have performed well. Bayer went down to $51.52 billion, facing challenges in their pharmaceutical sector. They are focusing on restructuring and innovation to regain growth. Sanofi’s revenue increased to $46.58 billion, supported by their specialty care and vaccines segments, despite pressures in the diabetes and cardiovascular sectors. AstraZeneca’s revenue grew by 3.29% to $45.81 billion, driven by their focus on oncology and rare diseases, along with the successful integration of Alexion Pharmaceuticals. Novartis reported a 7.66% increase, reaching $45.44 billion, bolstered by their innovative medicines and strong sales in oncology and gene therapy. Bristol-Myers Squibb saw a 2.50% decline, with revenue at $45.01 billion, impacted by the loss of exclusivity for key drugs and competition from generics. However, their diverse portfolio and recent product launches are expected to stabilize their performance.

In the fiscal year 2023, the leading pharmaceutical entities exhibited mixed performance trajectories. Several corporations, notably Johnson & Johnson, Merck, and AstraZeneca, demonstrated robust financial resilience and strategic market expansion. Conversely, businesses such as Pfizer and Roche encountered revenue contractions, primarily attributed to evolving market dynamics and intensified competitive forces. The biopharmaceutical sector continues to be characterized by significant flux, with sustained growth contingent upon continuous innovation and strategic corporate realignment to navigate the complex industry landscape.

Top 10 Companies by Business Operating Income

Top 10 Companies by Business Operating Income

In 2023, the pharmaceutical industry saw significant variations in business operating income among its leading companies, highlighting the impact of market dynamics and strategic decisions. Roche led the industry with an operating income of $21.42 billion, despite a 13.23% decrease from the previous year. This decline reflects the competitive pressures and challenges in their oncology portfolio. Janssen/Johnson & Johnson followed with $15.06 billion, experiencing a significant drop attributed to market competition and potential impacts from strategic shifts within the company.

Novo Nordisk, however, showed a remarkable performance with a 37.11% increase in operating income, reaching $14.89 billion. This growth was driven by strong sales in diabetes and obesity treatments. AbbVie reported $12.76 billion in operating income, a sharp 29.59% decrease, primarily due to the loss of exclusivity for key drugs like Humira. Novartis saw a positive trend with a 22.94% increase in operating income, totaling $9.77 billion, supported by their innovative medicines and strong sales in oncology. Sanofi’s operating income dropped by 26.10% to $8.52 billion, reflecting challenges in their vaccine and specialty care segments. Bristol-Myers Squibb, on the other hand, saw a 9.43% increase in operating income, reaching $8.44 billion, thanks to their diverse portfolio and recent product launches. AstraZeneca reported an impressive 118.07% increase in operating income, amounting to $8.19 billion, driven by successful integration of Alexion Pharmaceuticals and strong performance in oncology and rare diseases.

Amgen’s operating income fell to $7.90 billion, impacted by increased competition and market pressures. Gilead showed a modest increase of 3.75%, reaching $7.61 billion, supported by their HIV and hepatitis C treatments. GlaxoSmithKline (GSK) reported a 4.85% increase in operating income, totaling $7.30 billion, driven by strong sales in their vaccines and specialty pharmaceuticals. Eli Lilly’s operating income slightly decreased to $6.55 billion, with challenges in their diabetes and oncology segments. Abbott EPD saw a 22.53% decrease, resulting in $6.48 billion. Moderna experienced the largest drop in operating income, decreasing by 55.00% to $4.24 billion, primarily due to reduced demand for COVID-19 vaccines. Regeneron’s operating income also declined by 14.60%, totaling $4.05 billion, impacted by competitive pressures and market changes.

Top 10 Companies by Net Income

Top 10 Companies by Net Income

In 2023, the net income/profit of leading pharmaceutical companies varied significantly, reflecting their respective market strategies, product portfolios, and operational efficiencies. Janssen/Johnson & Johnson led the pack with a substantial net income of $35.15 billion. This impressive figure underscores their successful product lines in immunology and oncology, as well as their effective cost management strategies. Novartis followed with a net income of $14.85 billion, driven by their innovative medicines and robust sales in the oncology and gene therapy segments. Roche reported a net income of $13.76 billion, highlighting their strong performance in diagnostics and personalized healthcare despite competitive pressures in their oncology portfolio.

Novo Nordisk achieved a net income of $12.15 billion, reflecting a remarkable year with significant growth driven by their diabetes and obesity treatments. Bristol-Myers Squibb earned $8.04 billion in net income, supported by a diverse product portfolio and successful new product launches. Amgen reported a net income of $6.72 billion, despite facing increased competition and market pressures. AstraZeneca's net income stood at $5.96 billion, buoyed by their focus on oncology and rare diseases, and the successful integration of Alexion Pharmaceuticals. Sanofi reported a net income of $5.88 billion, supported by their specialty care and vaccines segments. GlaxoSmithKline (GSK) achieved a net income of $5.74 billion, driven by strong sales in vaccines and specialty pharmaceuticals. Abbott EPD rounded out the list with a net income of $5.72 billion. Despite facing competitive pressures and market dynamics, their diversified portfolio and strategic initiatives have helped maintain profitability.

Top 10 Companies by Total Assets

Top 10 Companies by Total Assets

In 2023, the total assets of leading pharmaceutical companies highlighted their significant market presence and resource base. Pfizer stood at the top with total assets valued at $226.50 billion, underscoring their extensive infrastructure, diverse product portfolio, and strategic acquisitions. Janssen/Johnson & Johnson followed with assets amounting to $167.56 billion, reflecting their robust operational base and sustained investment in R&D and market expansion. Sanofi reported total assets of $136.78 billion, supported by their comprehensive range of products in specialty care and vaccines. AbbVie had total assets worth $134.71 billion, indicative of their extensive investments in immunology and oncology. Bayer's assets totaled $125.74 billion, reflecting their diversified presence across pharmaceuticals, consumer health, and crop science.

Takeda's total assets were valued at $107.79 billion, driven by their global presence and strategic focus on key therapeutic areas. AstraZeneca reported assets of $101.12 billion, underscoring their strong market position in oncology and rare diseases. Roche had total assets amounting to $100.72 billion, showcasing their leadership in diagnostics and personalized healthcare. Novartis's total assets were valued at $99.95 billion, reflecting their significant investments in innovative medicines and high-growth therapeutic areas. Amgen reported total assets of $97.15 billion, supported by their focus on biologics and biosimilars. Overall, the total assets of these leading pharmaceutical companies in 2023 demonstrate their substantial market presence and capacity for sustained growth and innovation. Pfizer and Janssen/Johnson & Johnson lead the industry with the highest asset values, while other companies like Sanofi, AbbVie, and Bayer also maintain significant asset bases, enabling them to drive advancements in healthcare and pharmaceuticals.

Top 10 Companies by R&D expenditure

Top 10 Companies by R&D expenditure

In 2023, Research and Development (R&D) expenditures among leading pharmaceutical companies underscored their commitment to innovation and advancing healthcare. Merck led the industry with an impressive R&D expenditure of $30.53 billion, highlighting their substantial investment in discovering and developing new drugs and therapies. Janssen/Johnson & Johnson followed with $15.09 billion dedicated to R&D, reflecting their focus on maintaining a robust pipeline across various therapeutic areas. Roche allocated $14.74 billion to R&D, emphasizing their strong commitment to personalized healthcare and diagnostics. Novartis reported R&D expenses of $11.37 billion, driven by their investment in innovative medicines and cutting-edge research. AstraZeneca spent $10.94 billion on R&D, focusing on oncology and rare diseases, which have shown significant growth potential.

Pfizer's R&D expenditure totaled $10.68 billion, reflecting their efforts to expand their portfolio beyond COVID-19 treatments and into other high-impact areas. Eli Lilly invested $9.31 billion in R&D, emphasizing their focus on diabetes and oncology. Bristol-Myers Squibb reported R&D expenses of $9.30 billion, underlining their dedication to immunology and cardiovascular research. AbbVie spent $7.68 billion on R&D, maintaining their focus on immunology and oncology despite challenges from biosimilar competition. Sanofi's R&D expenditure was $7.28 billion, supporting their efforts in specialty care and vaccines.

Most Impactful Drugs of 2023

Leading pharmaceutical companies have developed groundbreaking drugs that have revolutionized treatment for various diseases. These innovations span across multiple therapeutic areas, including oncology, immunology, and rare diseases.

  • Johnson & Johnson's Darzalex for multiple Myeloma
  • Roche's Tecentriq for multiple Cancers
  • Merck's Keytruda, a blockbuster Immunotherapy
  • Pfizer's Comirnaty , the widely used COVID-19 Vaccine
  • AbbVie's Rinvoq for Rheumatoid Arthritis
  • Bayer's Xarelto , an Anticoagulant
  • Sanofi's Dupixent for Asthma and Atopic Dermatitis
  • AstraZeneca's Tagrisso for non-small cell Lung Cancer
  • Novartis's Zolgensma , a gene therapy for Spinal Muscular Atrophy
  • Bristol-Myers Squibb's Opdivo for various Cancers

These innovative drugs represent the competitive pharmaceutical research and development, offering new hope and improved quality of life for patients across a wide spectrum of diseases. As these companies continue to invest in research and push the boundaries of medical science, ChemAnalyst further anticipate even more groundbreaking treatments in the years to come, further transforming the landscape of global healthcare.

Research Methodology

The methodology for analyzing and ranking the world's top pharmaceutical manufacturing companies in 2023 involved a comprehensive and systematic approach. Initially, a thorough list of major global pharmaceutical manufacturers was compiled, covering a wide range of companies from various regions and market segments. The primary source of data for this analysis was the annual reports of these companies for the year 2023, with a particular focus on their consolidated balance sheets and financial statements. The cornerstone of the ranking system was the companies' net revenue or sales figures for 2023. This metric was chosen as the primary ranking factor due to its clear representation of a company's market presence and overall financial performance. It's worth noting that the financial reporting periods varied slightly among companies, with some publishing reports for the fiscal year ending in 2023, while others extended into March 2024. To accommodate these differences, the methodology allowed for flexibility in the reporting periods while maintaining a focus on the most recent and relevant financial data. The scope of the report extended beyond purely pharmaceutical companies to include businesses with diverse operations, such as those involved in chemical manufacturing or medical equipment production. However, to maintain focus and relevance, the ranking primarily considered the performance of their pharmaceutical drugs segment when evaluating these multifaceted corporations.

A key aspect of the methodology was the evaluation of year-over-year performance improvement. This was calculated as the percentage change in key financial metrics from 2022 to 2023. The analysis incorporated several crucial financial indicators to provide a holistic view of each company's performance:

  • 1 Sales or revenue: Reflecting the company's market performance and growth.
  • 2 EBIT (Earnings Before Interest and Taxes) or Business Operating Income: Indicating operational profitability.
  • 3 R&D (Research and Development) expenses: Highlighting investment in innovation and future growth.
  • 4 Capital expenditure (CAPEX): Showing investment in long-term assets and infrastructure.
  • 5 EBITDA (Earnings Before Interest, Taxes, Depreciation, and Amortization): Providing insight into operational efficiency and cash flow.

For each of these metrics, the percentage difference between 2023 and 2022 was calculated, offering a clear picture of year-over-year growth or decline. This multi-faceted approach allowed for a nuanced understanding of each company's financial health and strategic positioning.

Note: It's important to note that in some cases, certain financial indicators had to be omitted from the analysis. This was due to inconsistencies in how different companies reported their financials, with some metrics not clearly presented in annual reports or press releases. This limitation was carefully considered to ensure that the analysis remained fair and consistent across all companies. Also, to create a level playing field for international comparison, all financial figures were converted to billion US dollars (USD). The conversion rate used was the average of year 2023, ensuring that all companies were evaluated on the same currency basis, regardless of their home country or primary operational currency.

Disclaimer

The information provided in this ranking is intended to be informative and should not be relied upon as the sole factor in making any financial decisions. It is important to note that each country may have its own unique financial reporting regulations and that companies may use various methods to present their financial performance. Therefore, discrepancies in reported values may occur. While every effort has been made to generate this ranking using the most appropriate and relevant approach, any suggestions or feedback to improve its accuracy are welcome.