Global Sorbitol Market is projected to grow from USD 657 million in 2025 to USD 809 million by 2036, registering a CAGR of 1.91% during the forecast period. Sorbitol, a versatile hexahydric sugar alcohol, is predominantly synthesized via the high-pressure catalytic hydrogenation of D-glucose or dextrose derived from starch-rich agricultural feedstocks, mirroring the industrial production of mannitol but replacing the fructose or mannose substrate with widely accessible glucose to efficiently reduce the reactive aldehyde group into a stable hydroxyl group. This specific chemical conversion endows the polyol with distinct competitive advantages over traditional sucrose, notably exhibiting exceptional thermal stability that resists Maillard browning during high-temperature processing, alongside superior humectant, barrier, and plasticizing properties that optimize moisture retention and structural integrity in complex formulations. Fundamentally, the expanding consumption profile is anchored by shifting global dietary paradigms toward low-calorie, non-cariogenic sugar alternatives and a surging baseline demand for versatile excipients in complex pharmaceutical applications. Geographically, the Asia-Pacific region acts as the paramount economic catalyst for this industrial expansion, leveraging deep agricultural reserves of corn and cassava to secure cost-competitive supply chains while aggressively capitalizing on rapidly modernizing food processing and healthcare manufacturing sectors to drive sustained commercial momentum across the global landscape.
Sorbitol Applications in Packaging and Construction Industries
The dominant end-use applications for sorbitol are rooted in the food and beverage and personal care industries, where it is extensively utilized as a low-calorie sweetener, humectant, and texturizing agent. In oral care products like toothpaste and sugar-free chewing gums, this sugar alcohol is selected specifically for its non-cariogenic profile and excellent moisture-stabilizing capabilities, which prevent products from drying out while delivering a desirable cooling sensation without promoting dental caries. In the broader food sector, its high solubility, viscosity-enhancing properties, and ability to act as a crystallization modifier make it indispensable for formulating dietetic confectionery and baked goods. The primary forces propelling consumer and industrial demand center on its technical superiority in moisture management and a global consumer paradigm shift towards health-conscious, sugar-reduced lifestyles. Technically, sorbitol's efficacy as a superior humectant and plasticizer enables formulators to achieve extended product shelf stability, improved tactile textures in cosmetics, and enhanced moisture barriers in delicate emulsions. Furthermore, the rising consumer preference for clean-label, low-glycemic, and bio-based ingredients heavily favors sorbitol, as it effectively replicates the functional bulk and mouthfeel of conventional sucrose without the associated caloric load, aligning seamlessly with broader sustainability and wellness trends. Driven by these dual pillars of functional versatility and shifting demographic preferences, the overall market trajectory points toward robust expansion, characterized by increasing market penetration across emerging health sectors and expanding adoption in advanced personal care formulations globally.
Global Sorbitol Market Segmentation by Resin Type and End-Use Application
The global sorbitol market is primarily segmented by product form into liquid syrups and crystalline powders, and by end-user application encompassing food and beverages, pharmaceuticals, cosmetics and personal care, and industrial chemical synthesis. Within these broad classifications, the food and beverages segment currently holds the leading position, a dominance directly attributed to the chemical's widespread industrial adoption as a cost-effective, low-calorie bulk sweetener and its unparalleled thermal stability as a humectant essential for extending the shelf life of high-volume sugar-free confectioneries, chewing gums, and baked goods. Conversely, the pharmaceutical sector has emerged as the fastest-growing segment with the highest economic potential, heavily fueled by surging global demand for specific medical end-products such as pediatric liquid suspensions, chewable medicated lozenges, and plasticized softgel capsule casings. This accelerated growth trajectory is fundamentally driven by sorbitol's distinct technical properties as an advanced excipient and potent crystallization inhibitor, a highly specialized functionality that optimally preserves moisture balance, prevents the formulation from drying out, enhances the stable viscosity of liquid dosages, and ensures the long-term chemical integrity of sensitive active pharmaceutical ingredients without spiking patient glycemic indices.
Asia Pacific's Dominant Role in the Global Sorbitol Market
The Asia-Pacific region currently holds the undisputed leading position in the global sorbitol market, dominating the international landscape through an expansive manufacturing footprint and robust domestic utilization. This geographic leadership is fundamentally propelled by supportive regional regulatory frameworks, such as aggressive local manufacturing incentives under "Make in India" campaigns and explicit governmental sugar-reduction mandates embedded within the "Healthy China 2030" initiative, which collectively accelerate domestic ingredient adoption. Concurrently, broader consumer sentiments characterized by rapid urbanization, surging middle-class disposable incomes, and an acute demographic shift toward preventative healthcare and sugar-free dietary choices are amplifying regional demand. To sustain this momentum, the area exhibits a rigorous commitment to investment and research and development, heavily funding advanced enzymatic extraction technologies designed to maximize production efficiency from abundant native feedstocks like cassava and corn. Powered by these technological strides, the Asia-Pacific territory is actively driving the diversification of the chemical’s utility, pioneering its transition from conventional dietary applications into high-value pharmaceutical excipients and sustainable, bio-based personal care formulations, thereby cementing the region's role as the primary catalyst for the compound's evolving industrial footprint.
Recent Developments and Strategic Initiatives (2025)
The global sorbitol market is experiencing steady growth driven by rising demand in the food, beverage, and pharmaceutical sectors for sugar substitutes and humectants, prompting targeted capacity expansions by specific manufacturers. Reflecting this trend, in October 2024, Sanstar Limited announced a major capacity expansion at its Dhule facility, adding 1,000 tons per day of maize-based specialty products, including sorbitol, to address increasing international requirements for plant-based ingredients. Furthermore, in February 2025, Gulshan Polyols Ltd. continued to scale its output by expanding its sorbitol production capabilities at its integrated corn starch and dextrose facility in Gujarat, supplying various grades of liquid and powder sorbitol for low-calorie sweetener and excipient applications. These strategic investments underscore the industry focus on securing cost-effective domestic production to meet the expanding regulatory and consumer preference for functional, sugar-free formulations across global markets.
Key Players in the Global Sorbitol Market
Major players in the Global Sorbitol market are Archer Daniels Midland, Gujarat Ambuja Exports Limited, PT Sorini Agro Asia, Shandong Tianli Pharmaceutical Co, Shandong Tongchuang Biotechnology Co., Ltd.
Years considered for this report:
Historical Period: 2015-2024
Base Year: 2025
Estimated Year: 2026
Forecast Period: 2026-2036
This report will be delivered through an online digital platform with a one-year subscription, along with quarterly updates.
Objective of the Study:
• To assess the demand-supply scenario of the Sorbitol, covering production, demand, and supply at the global level.
• To analyze and forecast the market size of Sorbitol
• To classify and forecast the Global Sorbitol market based on end-use industries and regional distribution.
• To examine competitive developments in the global Sorbitol market, such as expansions, mergers & acquisitions, and other strategic initiatives.
Research Methodology: How Was the Sorbitol Market Data Collected?
To extract data for the Global Sorbitol market, primary research surveys were conducted with Sorbitol manufacturers, suppliers, distributors, wholesalers, and traders. During the interviews, respondents were also asked about their competitors.Through this approach, ChemAnalyst was able to identify and include manufacturers that could not be captured through secondary research due to its limitations.Moreover, ChemAnalyst analyzed various market segments and projected a positive outlook for the Global Sorbitol market over the coming years.
ChemAnalyst calculated the global demand for Sorbitol by analyzing the volume consumed by end-user industries. The forecast was developed based on the growth rates of these end-use industries. These values were obtained from industry experts and company representatives and were externally validated by analyzing the historical sales data of respective manufacturers to determine the overall market size. Additionally, various secondary sources, such as company websites, association reports, and annual reports, were reviewed by ChemAnalyst.
Key Target Audience for This Report
• Sorbitol manufacturers and other industry stakeholders
• Organizations, forums, and alliances related to Sorbitol distribution
• Government bodies, including regulatory authorities and policymakers
• Market research organizations and consulting firms
The study provides insights into several critical ques tions relevant to industry stakeholders, including Sorbitol manufacturers, customers, and policymakers. It also helps identify high-growth segments over the coming years, thereby supporting stakeholders in making informed investment decisions and facilitating strategic expansion.
Report Scope and Market Segmentation Framework
In this report, the Global Sorbitol market has been segmented into the following categories. In addition, key industry trends have been detailed below:
Attribute
Details
Market size Value in 2025
USD 657 Million
Market size Value in 2036
USD 809 Million
Growth Rate
CAGR of 1.91% from 2026 to 2036
Base year
2025
Estimated year
2026
Historical Data
2015 - 2024
Forecast period
2027 - 2036
Quantitative units
Demand in thousand tonnes and CAGR from 2026 to 2036
By Application (Animal feed, Pharmaceuticals, Food & Beverages and Others) By Type (Liquid and Powder) By Sales Channel (Direct Company Sale, Direct Import, Distributors & Traders)
Regional scope
North America; Europe; Asia Pacific; South America; Middle East & Africa
Market Data & Insights
Table of Content
1. Industry Market Size
It is an essential metric for market analysis, as it provides insights into the overall size and growth potential of Sorbitol market in terms of value and volume.
2. Capacity By Company
On our online platform, you can stay up to date with essential manufacturers and their current and future operation capacity on a practically real-time basis for Sorbitol.
3. Capacity By Location
To better understand the regional supply of Sorbitol by analyzing its manufacturers' location-based capacity.
4. Plant Operating Efficiency
To determine what percentage manufacturers are operating their plants or how much capacity is being currently used.
5. Production By Company
Study the historical annual production of Sorbitol by the leading players and forecast how it will grow in the coming years.
6. Demand by End- Use
Discover which end-user industry (Animal Feed, Food & Beverage, Pharmaceuticals and Others) are creating a market and the forecast for the growth of the Sorbitol market.
7. Demand by Region
Analyzing the change in demand of Sorbitol in different regions, i.e., North America, Europe, Asia Pacific, Middle East and Africa, and South America, that can direct you in mapping the regional demand.
8. Demand by Sales Channel (Direct and Indirect)
Multiple channels are used to sell Sorbitol. Our sales channel will help in analyzing whether distributors and dealers or direct sales make up most of the industry's sales.
9. Demand-Supply Gap
Determine the demand supply gap to gain information about the trade surplus or deficiency of Sorbitol.
10. Company Share
Figure out what proportion of the market share of Sorbitol is currently held by leading players across the globe.
I am satisfied with overall performance of ChemAnalyst. Weekly updates before the final report were especially helpful and reassuring. Additional requests on the interim and/or final reports were handled in a swift and professional manner
Mr.Shin Dosho
Member - Board of Directors
Osaka Gas Co. Ltd
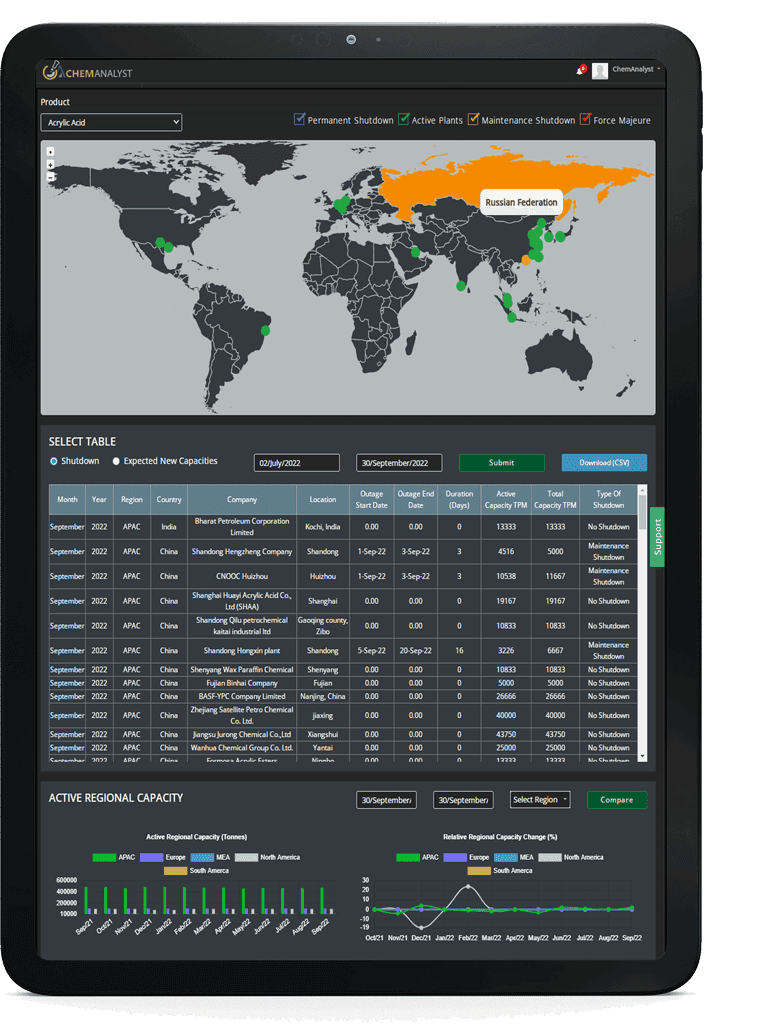
Disruption Tracker
Disruption Tracker reflect the major shutdown on monthly basis which will help you in
tracking the inventory management and smooth functioning of business. Unforeseen shutdowns and disruptions
resulting in a loss of production capacity to impact the bottom line. The capacity tracker provides industries
with a global view of production and consumption capacity loss that reflects the corresponding conversion factors.
It also highlights the immediate impact on supply due to planned and unplanned outages as well as upcoming start-up
of new capacities. Additionally, it emphasizes how each shutdown—whether due to a maintenance turnaround or a case
of force majeure, affects the plant's operating rate for the given duration. Disruption tracker gives a clear insight
into the worldwide outages affecting the commodity of interest. With every shutdown, it also reflects the impact on
supply of the product in the market at a Global level.
The Global Sorbitol Market was valued at USD 657 million in 2025 and is projected to reach USD 809 million by 2036, growing at a CAGR of 1.91% during the forecast period.
The report covers market sizing and forecasting (2015–2036), segmentation, regional analysis, competitive landscape, and recent strategic developments. It also offers solutions including Custom Research for tailored business strategies.
Our Solutions
Custom Research
We at ChemAnalyst provide tailor-made solutions to our clients based on their requirements which help them in building and expanding their business by developing customized strategy such as sales strategy, GTM Strategy, product portfolio and new product development. Our dedicated team helps clients in getting the best solution for their requirements. We at ChemAnalyst look forward to serving our clients for long term association.
Techno Economic Feasibility Report (TEFR)
ChemAnalyst provide TEFR reports which include market sizing, plant cost (ISBL and OSBL units), financial modelling, covering all the major financial calculations and ratios including production cost, IRR, major technology, licensing fee (if required), and others fixed and variable costs. TEFR reports will help the client to build greenfield project as well as brownfield expansion for a specific geography. Our Team of experts have delivered multiple TEFR reports which help clients in moving ahead of their business competition by grabbing the opportunity and expanding their business portfolio.
Price Benchmarking
Pricing benchmark report provides real-time data perpetuating current market scenarios, in a world that is changing at a rapid pace, having real-time prices is an imperative to make impactful insights and thereby informed decisions. The Price Benchmarking report provides pricing data for an individual market, or group of markets, which can be converted into localized insights and comparable listings. Benchmarking Reports help clients to make informed decisions by construing the data on several filters: region, country, category, grade and subsequently increasing their brand presence. Clients majorly require pricing benchmarks when they opt for a competitive pricing strategy.
We use cookies to deliver the best possible experience on our website. To learn more, visit our
Privacy Policy.
By continuing to use this site or by closing this box, you consent to our use of cookies.
More info.