[Online Quarterly Update] Barrier Film demand stood at 1.05 Million Tonnes in 2020 and is anticipated to reach 2.10 Million Tonnes by 2030, growing at a healthy CAGR of 6.59% until 2030. High barrier films are flexible films that prevent oxygen water, light, and other elements from entering or exiting a product’s packaging. The added advantage over conventional films such as resealable zippers & sliders, faster machining speed, increased heat tolerance, extend shelf life, etc are making it a preferred material for packaging application. Packaging demand is highly influenced by the economic cycle. By end-use, the market is segmented into Food & Beverage, Pharmaceutical, Agriculture, Others. Consumer spending on the food and beverage market provides higher stability over the economic cycle and thus compared to the non-food application making it a dominating segment in the global barrier film end-use market. Based on material, the market is segmented into PE, PET, PP, Organic Coatings, Polyamide, Inorganic Oxide Coatings. Due to its excellent moisture barrier properties, PE holds the major share in the global barrier film market. Multi-layer film barriers generally are preferred over single-layered in the application where special applications are required such as pharmaceutical products where specific environmental conditions are must.
Due to the outbreak of COVID-19 in 2020, the world economy was disrupted. The market was affected drastically, and production and manufacturing units were shut down. Furthermore, the major market players intentionally halted the production keeping their employee’s health and wellness in mind. With imposed new regulations of the COVID-19 and proper precautions, the market is anticipated to regain its growth in the years to come. The pandemic is slowly being subsided and the effects are tried to be overcome by various methods. Once the market regains the full function of its production unit, the market is bound to show robust growth in the forecast period. Although, the widespread Covid-19 pandemic also created a sudden surge in the demand for Film barriers from Pharmaceutical packaging. Also, for non-food & beverage applications, the demand for film barriers is expected to rise from cosmetics and pharmaceuticals for the forecasted period that probably would recover the setback and regain the growth rate of the market.
The Asia Pacific accounted for the largest share of the global barrier film market. The packaging industry has grown rapidly in the last decade from emerging nations such as China, India, Indonesia and is further expected to grow at a healthy rate on account of growing affluent middle class, more preference for ready to eat foods, smaller packaging units, and booming online shopping market. Enhanced product portfolio from major consumer goods companies in the region is expected to further propel the market for the forecasted period.
Some of the major key players operating in Global film barrier market are Amcor PLC, Berry Global Inc, Mondi Group, Huhtamaki group, Raven Industries, Toppan Printing Co Ltd, Cosmo Films Ltd, Jindal Poly films Ltd, Dupont Teijin Films, UFlex Ltd, Sumitomo Chemical Co Ltd. Sustainable packaging focussing on lowering the environmental impact of packaging have become key goals for brand owners. These trends are encouraging the demand for high-barrier films.
The pricing of film barrier is largely dependent on fluctuations in crude oil, Natural Gas and other upstream sources
Years considered for this report:
Historical Period: 2015-2019
Base Year: 2020
Estimated Year: 2021
Forecast Period: 2022–2030
This report will be delivered on an online digital platform with one-year subscription and quarterly update.
Objective of the Study:
• To assess the demand-supply scenario of Film Barrier fabrics which covers production, demand and supply of Film Barrier fabrics market globally.
• To analyze and forecast the market size of Film Barrier fabrics.
• To classify and forecast global Film Barrier fabrics market based on Material, type, end-use and regional distribution.
• To identify drivers and challenges for global Film Barrier fabrics market.
• To examine competitive developments such as expansions, new product launches, mergers & acquisitions, etc., in global Film Barrier fabrics market.
• To identify and analyze the profile of leading players involved in the manufacturing of Film Barrier fabrics.
To extract data for global Film Barrier market, primary research surveys were conducted with Film Barrier manufacturers, suppliers, distributors, wholesalers and end users. While interviewing, the respondents were also inquired about their competitors. Through this technique, ChemAnalyst was able to include manufacturers that could not be identified due to the limitations of secondary research. Moreover, ChemAnalyst analyzed various end user segments and projected a positive outlook for Global Film Barrier market over the coming years.
ChemAnalyst calculated Film Barrier demand globally by analyzing the historical data and demand forecast which was carried out considering imported styrene prices, a monomer used for production of Film Barrier. ChemAnalyst sourced these values from industry experts and company representatives and externally validated through analyzing historical sales data of respective manufacturers to arrive at the overall market size. Various secondary sources such as company websites, association reports, annual reports, etc., were also studied by ChemAnalyst.
Key Target Audience:
• Film Barrier manufacturers and other stakeholders
• Organizations, forums and alliances related to Film Barrier distribution
• Government bodies such as regulating authorities and policy makers
• Market research organizations and consulting companies
The study is useful in providing answers to several critical questions that are important for industry stakeholders such as Film Barrier fabrics manufacturers, customers and policy makers. The study would also help them to target the growing segments over the coming years (next two to five years), thereby aiding the stakeholders in taking investment decisions and facilitating their expansion.
Report Scope:
In this report, global film barrier market has been segmented into following categories, in addition to the industry trends which have also been detailed below:
By End Use: (Food & Beverage Packaging, Pharmaceutical Packaging, Personal care, others)
By Sales Channel: (Direct Company Sale, Direct Import, Distributors & Traders)
Regional scope
North America; Europe; Asia Pacific; South America; Middle East & Africa
Country scope
United States; Mexico; Canada; China; India; Japan; South Korea; Taiwan; Singapore; Germany; Belgium; France; United Kingdom; Spain; Italy; Sweden; Austria; Saudi Arabia; Iran; South Africa; Brazil; Argentina
Key companies profiled
Amcor PLC, Berry Global Inc, Mondi Group, Huhtamaki group, Raven Industries, Toppan Printing Co Ltd, Cosmo Films Ltd, Jindal Poly films Ltd, Dupont Teijin Films, UFlex Ltd, Sumitomo Chemical Co Ltd.
Customization scope
Free report customization with purchase. Addition or alteration to country, regional & segment scope.
I am satisfied with overall performance of ChemAnalyst. Weekly updates before the final report were especially helpful and reassuring. Additional requests on the interim and/or final reports were handled in a swift and professional manner
Mr.Shin Dosho
Member - Board of Directors
Osaka Gas Co. Ltd
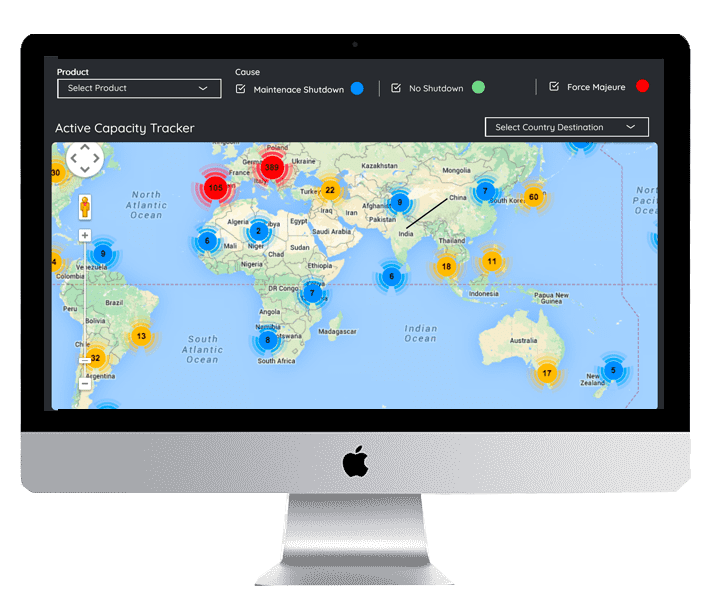
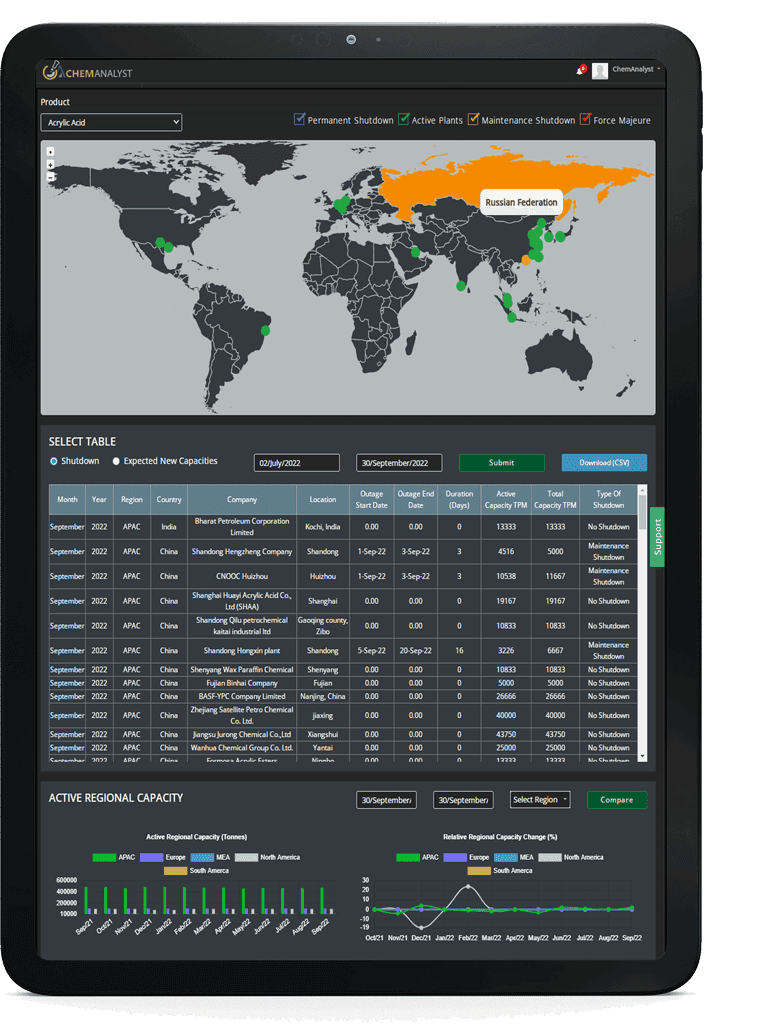
Disruption Tracker
Disruption Tracker reflect the major shutdown on monthly basis which will help you in
tracking the inventory management and smooth functioning of business. Unforeseen shutdowns and disruptions
resulting in a loss of production capacity to impact the bottom line. The capacity tracker provides industries
with a global view of production and consumption capacity loss that reflects the corresponding conversion factors.
It also highlights the immediate impact on supply due to planned and unplanned outages as well as upcoming start-up
of new capacities. Additionally, it emphasizes how each shutdown—whether due to a maintenance turnaround or a case
of force majeure, affects the plant's operating rate for the given duration. Disruption tracker gives a clear insight
into the worldwide outages affecting the commodity of interest. With every shutdown, it also reflects the impact on
supply of the product in the market at a Global level.
Frequently Asked Question (FAQ)
Our Solutions
Custom Research
We at ChemAnalyst provide tailor-made solutions to our clients based on their requirements which help them in building and expanding their business by developing customized strategy such as sales strategy, GTM Strategy, product portfolio and new product development. Our dedicated team helps clients in getting the best solution for their requirements. We at ChemAnalyst look forward to serving our clients for long term association.
Techno Economic Feasibility Report (TEFR)
ChemAnalyst provide TEFR reports which include market sizing, plant cost (ISBL and OSBL units), financial modelling, covering all the major financial calculations and ratios including production cost, IRR, major technology, licensing fee (if required), and others fixed and variable costs. TEFR reports will help the client to build greenfield project as well as brownfield expansion for a specific geography. Our Team of experts have delivered multiple TEFR reports which help clients in moving ahead of their business competition by grabbing the opportunity and expanding their business portfolio.
Price Benchmarking
Pricing benchmark report provides real-time data perpetuating current market scenarios, in a world that is changing at a rapid pace, having real-time prices is an imperative to make impactful insights and thereby informed decisions. The Price Benchmarking report provides pricing data for an individual market, or group of markets, which can be converted into localized insights and comparable listings. Benchmarking Reports help clients to make informed decisions by construing the data on several filters: region, country, category, grade and subsequently increasing their brand presence. Clients majorly require pricing benchmarks when they opt for a competitive pricing strategy.
We use cookies to deliver the best possible experience on our website. To learn more, visit our
Privacy Policy.
By continuing to use this site or by closing this box, you consent to our use of cookies.
More info.