H1 2023: In H1 2023, Europe witnessed mixed market segments for Isopropyl Alcohol (IPA). In the first three months of 2023, IPA prices fell in Germany, due to weak demand by the downstream industries and rise in the inventories from various end-use sectors. This was due to low purchasing activity and softened upstream costs in Germany. IPA prices again hiked in Germany in April 2023. However, prices dropped in the end of April 2023. IPA prices continued to show downward trend in May 2023 due to a steady decline in Europe’s demand and a significant slowdown in import momentum. Purchasing activity from downstream industries, primarily pharmaceuticals industry, declined significantly as prominent number of buyers focused on keeping inventories and sourcing materials in adequate quantities to meet their needs in the German market. In addition, upstream propylene prices also fell sharply in the June 2023 due to weak demand and oversupply, further contributing to weak market sentiment for IPA in Europe, especially Germany.
H1 2022: The leading producers of Isopropyl Alcohol (IPA) in H1 2022 in Europe were Sasol Germany, Novapex, JSC Himtek Engineering. Based on production capacity, Sasol Germany was leading across Europe in H1 2022. In H1 2022, Europe witnessed mixed market segments for IPA. IPA prices fell in Europe in February 2022 due to high inventories and decline in the product demand in markets of European countries. However, due to significant tensions between Russia and Ukraine over the war, in March 2022, IPA prices began to push higher. The major caused which was behind the hike of prices in the region was due to high oil prices and significant impact on prices of acetone and propylene in the region. Moreover, the acceleration in the demand from the downstream automotive, paints and coatings sectors also influenced the IPA high prices across Europe. However, from April 2022 the isopropyl alcohol market experienced shift in market dynamics due to low input costs. Declining downstream demand from the personal care and chemical sectors impacted the price value of isopropyl alcohol to move in the downwards manner. Additionally, the volatility in raw material propylene prices impacted the IPA market in Europe.
H2 2022: In H2 2022, the European Isopropyl Alcohol market showcased a mixed scenario just like H1 2022. From July 2022 to mid- August 2022, Isopropyl Alcohol prices fell across Europe owing to the weak IPA demand in Europe and excess of the inventories in the region. Prices increased significantly towards the mid- August 2022 due to high demand in the region and customer inquiries in the regional market. The high demand for IPA prompted the market participants to keep elevating the product prices and replenish declining inventories in order to maintain profit margins. Although, the demand of IPA was still weak from October 2022 to mid-November 2022 across Europe. Customer inquiries were weak in these months and the downstream demand in the domestic market had also declined, which supported weak prices for isopropyl alcohol in Germany. However, Isopropyl Alcohol prices again rose in the middle of November 2022 as there was a significant increase in demand from the downstream end-user industries like pharmaceutical, coatings and chemical sectors. Additionally, in December 2022, the raw material (propylene) prices shifted towards a higher side, which supported the upward trend of Isopropyl Alcohol prices in Germany.
The Europe Isopropyl Alcohol (IPA) market stood at nearly 700 thousand tonnes in 2022 and is expected to grow at a steady CAGR of 4.74% during the forecast period until 2030.
IPA is a versatile, flammable substance with a wide range of uses in many different sectors. IPA is frequently used in both the manufacture of many chemical compounds, as a solvent and in the manufacturing of cosmetics and fragrances. It is utilized in a number of industrial operations, as well as flammable combinations and as a deicer. It works well as a solvent while making printing ink. It is also utilized as a cleaning agent, antiseptic, surface disinfectant, household solvent, electronic component cleaner, astringent, etc. Due to their low toxicity levels and high evaporation rate, they are also widely employed in the pharmaceutical industry to make numerous items. Alcohol swabs and wipes for cleansing wounds contain isopropyl alcohol with a 70% concentration. Additionally, ear drops and hand sanitizers also include them. Isopropyl alcohol is also present in some amounts in oral mouthwash solutions. In the electronic industry, Isopropyl alcohol is used to remove flux remnants from recently soldered circuit boards or in PCB repair and rework for electronic printed circuit board (PCB) assembly.
The rising demand mainly comes from the pharmaceutical industry across Europe. The increasing health concerns and disinfection across healthcare centers and hospitals call for IPA and are likely to promote market expansion in the upcoming years. Europe’s IPA market growth rate is due to its rising consumer base as well as the presence of major pharma companies such as Novartis AG, GSK plc, AstraZeneca Plc, and Bayer AG, located in the region. Furthermore, the growing usage of IPA in the cosmetic industry owing to its non-toxic nature is positively influencing the growth of Isopropyl Alcohol (IPA). Furthermore, the rising usage of IPA as a solvent for producing paints & coatings which are further used by various downstream industries like automotive and construction coupled with a hike in architecture maintenance and automotive manufacturing is likely to bolster the IPA market growth rate across Europe. Germany leads Europe’s automotive market with the presence of major companies like Bayerische Motoren Werke AG, Volkswagen, Alpina, and Mercedes-AMG GmbH, located in the country. Europe's Isopropyl Alcohol (IPA) market is expected to reach 1000 thousand tonnes in the year 2030.
Based on the end-user industry, the Europe Isopropyl Alcohol (IPA) market is segregated into Pharmaceuticals, Chemicals, Paints and coatings, Cosmetics, and Others. However, Pharmaceuticals are dominating the Europe Isopropyl Alcohol (IPA) market. This industry consumed approximately about 36% of the market in 2022 and is anticipated to maintain its dominance in the forecast period. Isopropyl alcohol is a common ingredient in cosmetics, owing to its pigment-wetting property. It can be found in most cosmetic & toiletry items, including skincare, makeup, aftershave lotion, nail, and hair care products.
Significant players in the Europe Isopropyl Alcohol (IPA) market are Sasol Germany, Novapex, JSC Himtek Engineering, Seqens, Shell Nederland Chemie BV, BP, Shell, and Indorama Ventures Química S.L.U.
Years considered for this report:
Historical Period: 2015- 2022
Base Year: 2022
Estimated Year: 2023
Forecast Period: 2024-2030
This report will be delivered on an online digital platform with one-year subscription and quarterly update.
Objective of the Study:
• To assess the demand-supply scenario of Isopropyl Alcohol (IPA) which covers production, demand and supply of Isopropyl Alcohol (IPA) market in the Europe.
• To analyse and forecast the market size of Isopropyl Alcohol (IPA)
• To classify and forecast Europe Isopropyl Alcohol (IPA) market based on end-use and regional distribution.
• To examine competitive developments such as expansions, mergers & acquisitions, etc., of Isopropyl Alcohol (IPA) market in the Europe.
To extract data for Europe Isopropyl Alcohol (IPA) market, primary research surveys were conducted with Isopropyl Alcohol (IPA) manufacturers, suppliers, distributors, wholesalers and Traders. While interviewing, the respondents were also inquired about their competitors. Through this technique, ChemAnalyst was able to include manufacturers that could not be identified due to the limitations of secondary research. Moreover, ChemAnalyst analyzed various segments and projected a positive outlook for Europe Isopropyl Alcohol (IPA) market over the coming years.
ChemAnalyst calculated Isopropyl Alcohol (IPA) demand in Europe by analyzing the historical data and demand forecast which was carried out considering the consumption of Isopropyl Alcohol (IPA) by the end-user industries. ChemAnalyst sourced these values from industry experts and company representatives and externally validated through analyzing historical sales data of respective manufacturers to arrive at the overall market size. Various secondary sources such as company websites, association reports, annual reports, etc., were also studied by ChemAnalyst.
Key Target Audience:
• Isopropyl Alcohol (IPA) manufacturers and other stakeholders
• Organizations, forums and alliances related to Isopropyl Alcohol (IPA) distribution
• Government bodies such as regulating authorities and policy makers
• Market research organizations and consulting companies
The study is useful in providing answers to several critical questions that are important for industry stakeholders such as Isopropyl Alcohol (IPA) s manufacturers, customers and policy makers. The study would also help them to target the growing segments over the coming years (next two to five years), thereby aiding the stakeholders in taking investment decisions and facilitating their expansion.
Report Scope:
In this report, Europe Isopropyl Alcohol (IPA) market has been segmented into following categories, in addition to the industry trends which have also been detailed below:
Attribute
Details
Market size Volume in 2022
700 thousand tonnes
Market size Volume by 2030
1000 thousand tonnes
Growth Rate
CAGR of 4.74% from 2023 to 2030
Base year for estimation
2023
Historic Data
2015 – 2022
Forecast period
2024 – 2030
Quantitative units
Demand in thousand tonnes and CAGR from 2023 to 2030
Report coverage
Industry Market Size, Capacity by Company, Capacity by Location, Operating Efficiency, Production by Company, Demand by End- Use, Demand by Region, Demand by Sales Channel, Demand-Supply Gap, Company Share, Foreign Trade
Segments covered
By End-Use: (Pharmaceuticals, Chemicals, Paints and coatings, Cosmetics, and Others)
By Sales Channel: (Direct Sale and Indirect Sale)
Regional scope
Southern Europe, Eastern Europe, Western Europe, and Northern Europe
With the given market data, ChemAnalyst offers customizations according to a company’s specific needs.
In case you do not find what, you are looking for, please get in touch with our custom research team at sales@chemanalyst.com
Market Data & Insights
Table of Content
1. Industry Market Size
It is an essential metric for market analysis, as it provides insights into the overall size and growth potential of Isopropyl Alcohol (IPA) market in terms of value and volume.
2. Capacity By Company
On our online platform, you can stay up to date with essential manufacturers and their current and future operation capacity on a practically real-time basis for Isopropyl Alcohol (IPA).
3. Capacity By Location
To better understand the regional supply of Isopropyl Alcohol (IPA) by analyzing its manufacturers' location-based capacity.
4. Plant Operating Efficiency
To determine what percentage manufacturers are operating their plants or how much capacity is being currently used.
5. Production By Company [Quarterly Update]
Study the historical annual production of Isopropyl Alcohol (IPA) by the leading players and forecast how it will grow in the coming years.
6. Demand by End- Use [Quarterly Update]
Discover which end-user industry (Pharmaceuticals, Chemicals, Paints and coatings, Cosmetics, and Others) are creating a market and the forecast for the growth of the Isopropyl Alcohol (IPA) market.
7. Demand by Region
Analyzing the change in demand of Isopropyl Alcohol (IPA) in different regions, i.e., Southern Europe, Eastern Europe, Western Europe, and Northern Europe, that can direct you in mapping the regional demand.
8. Demand by Sales Channel (Direct and Indirect)
Multiple channels are used to sell Isopropyl Alcohol (IPA). Our sales channel will help in analyzing whether distributors and dealers or direct sales make up most of the industry's sales.
9. Demand-Supply Gap
Determine the supply-demand gap to gain information about the trade surplus or deficiency of Isopropyl Alcohol (IPA).
10. Company Share
Figure out what proportion of the market share of Isopropyl Alcohol (IPA) is currently held by leading players across the Europe.
11. Country-wise Export
Get details about quantity of Isopropyl Alcohol (IPA) exported by major countries.
12. Country-wise Import
Get details about quantity of Isopropyl Alcohol (IPA) imported by major countries.
I am satisfied with overall performance of ChemAnalyst. Weekly updates before the final report were especially helpful and reassuring. Additional requests on the interim and/or final reports were handled in a swift and professional manner
Mr.Shin Dosho
Member - Board of Directors
Osaka Gas Co. Ltd
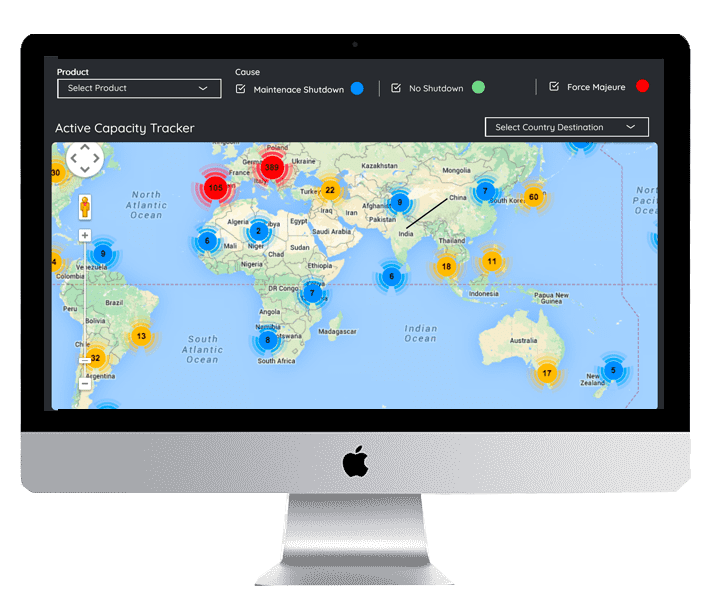
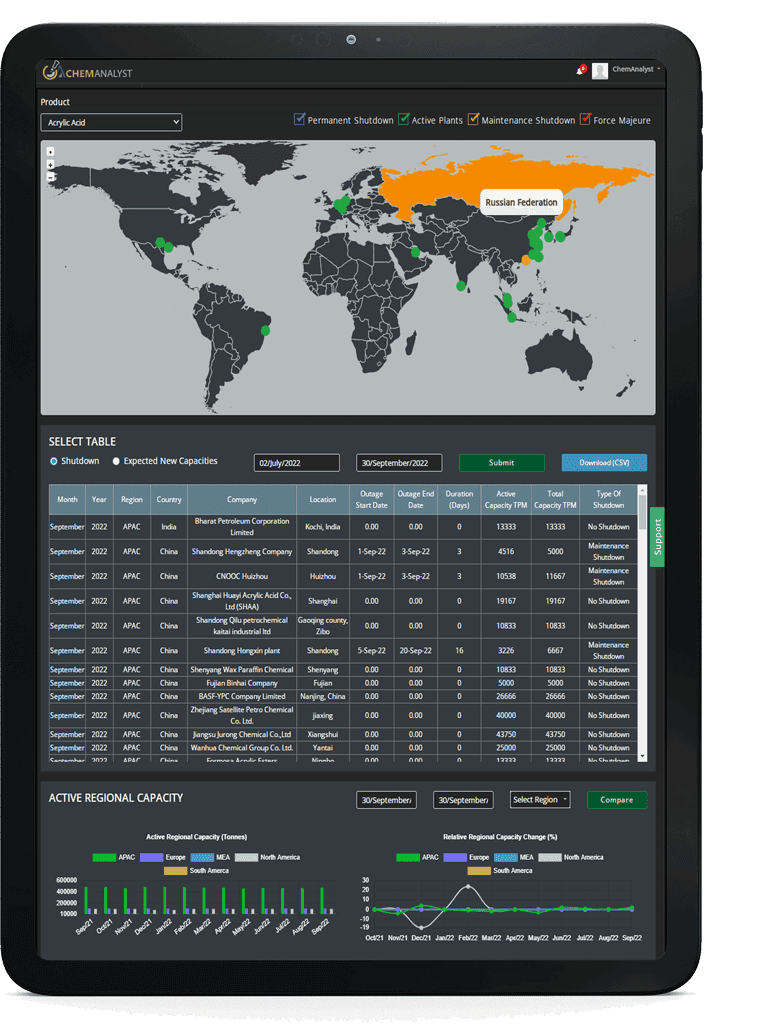
Disruption Tracker
Disruption Tracker reflect the major shutdown on monthly basis which will help you in
tracking the inventory management and smooth functioning of business. Unforeseen shutdowns and disruptions
resulting in a loss of production capacity to impact the bottom line. The capacity tracker provides industries
with a global view of production and consumption capacity loss that reflects the corresponding conversion factors.
It also highlights the immediate impact on supply due to planned and unplanned outages as well as upcoming start-up
of new capacities. Additionally, it emphasizes how each shutdown—whether due to a maintenance turnaround or a case
of force majeure, affects the plant's operating rate for the given duration. Disruption tracker gives a clear insight
into the worldwide outages affecting the commodity of interest. With every shutdown, it also reflects the impact on
supply of the product in the market at a Global level.
The Europe market size of Isopropyl Alcohol (IPA) has grown significantly in the historic period of 2015-2022 and reached approximately 700 thousand tonnes in 2022.
Online Access 12 Months – Single User License (Up to 3 users can access the database) Online Access 12 Months – Enterprise License (Up to 10 Users can access the database)
You will have 24/7 access to the analyst during the subscription period.
Our Solutions
Custom Research
We at ChemAnalyst provide tailor-made solutions to our clients based on their requirements which help them in building and expanding their business by developing customized strategy such as sales strategy, GTM Strategy, product portfolio and new product development. Our dedicated team helps clients in getting the best solution for their requirements. We at ChemAnalyst look forward to serving our clients for long term association.
Techno Economic Feasibility Report (TEFR)
ChemAnalyst provide TEFR reports which include market sizing, plant cost (ISBL and OSBL units), financial modelling, covering all the major financial calculations and ratios including production cost, IRR, major technology, licensing fee (if required), and others fixed and variable costs. TEFR reports will help the client to build greenfield project as well as brownfield expansion for a specific geography. Our Team of experts have delivered multiple TEFR reports which help clients in moving ahead of their business competition by grabbing the opportunity and expanding their business portfolio.
Price Benchmarking
Pricing benchmark report provides real-time data perpetuating current market scenarios, in a world that is changing at a rapid pace, having real-time prices is an imperative to make impactful insights and thereby informed decisions. The Price Benchmarking report provides pricing data for an individual market, or group of markets, which can be converted into localized insights and comparable listings. Benchmarking Reports help clients to make informed decisions by construing the data on several filters: region, country, category, grade and subsequently increasing their brand presence. Clients majorly require pricing benchmarks when they opt for a competitive pricing strategy.
We use cookies to deliver the best possible experience on our website. To learn more, visit our
Privacy Policy.
By continuing to use this site or by closing this box, you consent to our use of cookies.
More info.