[Online Quarterly Update] E-mobility Raw Materials demand stood at 1.2 Million Tonnes in 2020 and is forecast to reach 4.42 Million Tonnes by 2030, growing at a healthy CAGR of 14.35% until 2030.
E-Mobility Raw Materials are the materials that are required for the manufacturing of electric vehicles. They are of several types, including body metals, lightweight plastic, and battery chemicals and metals which include cobalt, lithium, and copper. Major application areas of E-Mobility Raw Materials include public transport, commercial vehicles, and personal vehicles. The surge in greenhouse gases and carbon footprint of the automotive and transportation industries are promoting the use of electric-mobility vehicles, which in turn is expected to boost market growth.
Growing demand for electric vehicles coupled with the stronger government support worldwide for electric vehicles is expected to drive the demand for E-Mobility Raw Materials for the forecast period. Additionally, the growing population and awareness about the environment-friendly nature of electric vehicles are going to push the demand further during the forecast period. Lack of charging infrastructure in many countries is expected to hinder demand growth of E-Mobility Raw Materials during the forecast period.
In 2020, the spread of COVID-19 in major global economies caused nationwide lockdowns, which had an impact on a number of industries. Automotive was among the most affected industries during the pandemic. Manufacturing units were temporarily shut down, and disruption in the supply chain was observed. This caused an adverse impact on the demand for E-Mobility Raw Materials for the first half of 2020. The demand for E-Mobility Raw Materials fell during the coronavirus pandemic and the market is expected to pick up the pace eventually.
Region-wise, the Asia-pacific region holds the major share of global demand for E-Mobility Raw Materials due to the increasing demand of application industries such as electric automotive. Moreover, increasing population and rise in per capita income in emerging economies like India and China coupled with the growing number of vehicles using E-Mobility Raw Materials are significant factors influencing the demand for the e-mobility market in the forecast period.
Major companies operating in the E-Mobility Raw Materials market include LANXESS AG, BASF SE, The Dow Chemical, Toray Industries Inc. Evonik, Covestro, Sabic, Lyondell Basell, and others.
Years considered for this report:
Historical Period: 2015-2019
Base Year: 2020
Estimated Year: 2021
Forecast Period: 2022–2030
This report will be delivered on an online digital platform with one-year subscription and quarterly update.
Objective of the Study:
•To assess the demand-supply scenario of E-Mobility Raw Materials which covers production, demand and supply of E-Mobility Raw Materials market globally.
•To analyse and forecast the market size of E-Mobility Raw Materials.
•To classify and forecast global E-Mobility Raw Materials market based on by application, by type, by chemical and regional distribution.
•To identify drivers and challenges for global E-Mobility Raw Materials market.
•To examine competitive developments such as expansions, new product launches, mergers & acquisitions, etc., in global E-Mobility Raw Materials market.
•To identify and analyse the profile of leading players involved in the manufacturing of E-Mobility Raw Materials.
To extract data for global E-Mobility Raw Materials market, primary research surveys were conducted with E-Mobility Raw Materials manufacturers, suppliers, distributors, wholesalers and end users. While interviewing, the respondents were also inquired about their competitors. Through this technique, ChemAnalyst was able to include manufacturers that could not be identified due to the limitations of secondary research. Moreover, ChemAnalyst analyzed various end user segments and projected a positive outlook for Global E-Mobility Raw Materials market over the coming years.
ChemAnalyst calculated E-Mobility Raw Materials demand globally by analyzing the historical data and demand forecast which was carried out considering imported E-Mobility Raw Materials, prices, materials used for production of E-Mobility Raw Materials. ChemAnalyst sourced these values from industry experts and company representatives and externally validated through analyzing historical sales data of respective manufacturers to arrive at the overall market size. Various secondary sources such as company websites, association reports, annual reports, etc., were also studied by ChemAnalyst.
Key Target Audience:
• E-Mobility Raw Materials manufacturers and other stakeholders
•Organizations, forums and alliances related to E-Mobility Raw Materials distribution.
•Government bodies such as regulating authorities and policy makers
•Market research organizations and consulting companies
The study is useful in providing answers to several critical questions that are important for industry stakeholders such as E-Mobility Raw Materials manufacturers, customers and policy makers. The study would also help them to target the growing segments over the coming years (next two to five years), thereby aiding the stakeholders in taking investment decisions and facilitating their expansion.
Report Scope:
In this report, global E-Mobility Raw Materials market has been segmented into following categories, in addition to the industry trends which have also been detailed below:
By Application: (Public Transport, Commercial Vehicle, Personal Vehicle)
By Type: (Body Metals, Light Weight Plastic, Battery chemicals and Metals)
By Chemical Type: (Polyamide 6 and 66, Polyphenylene Sulfide (PPS), Polybutylene Terephthalate (PBT), PP Copolymer, Polycarbonate (PC), PE Compound, Others)
By Sales Channel: (Direct Company Sale, Direct Import, Distributors & Traders)
Regional scope
North America; Europe; Asia Pacific; South America; Middle East & Africa
Country scope
United States; Mexico; Canada; China; India; Japan; South Korea; Taiwan; Singapore; Germany; Belgium; France; United Kingdom; Spain; Italy; Sweden; Austria; Saudi Arabia; Iran; South Africa; Brazil; Argentina
Key companies profiled
LANXESS AG, BASF SE, The Dow Chemical, Toray Industries Inc. Evonik, Covestro, Sabic, Lyondell Basell, and others.
Customization scope
Free report customization with purchase. Addition or alteration to country, regional & segment scope.
I am satisfied with overall performance of ChemAnalyst. Weekly updates before the final report were especially helpful and reassuring. Additional requests on the interim and/or final reports were handled in a swift and professional manner
Mr.Shin Dosho
Member - Board of Directors
Osaka Gas Co. Ltd
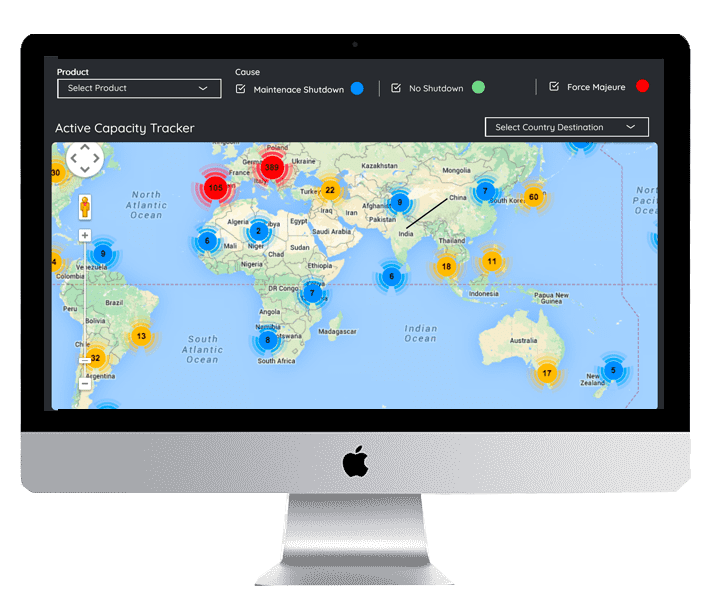
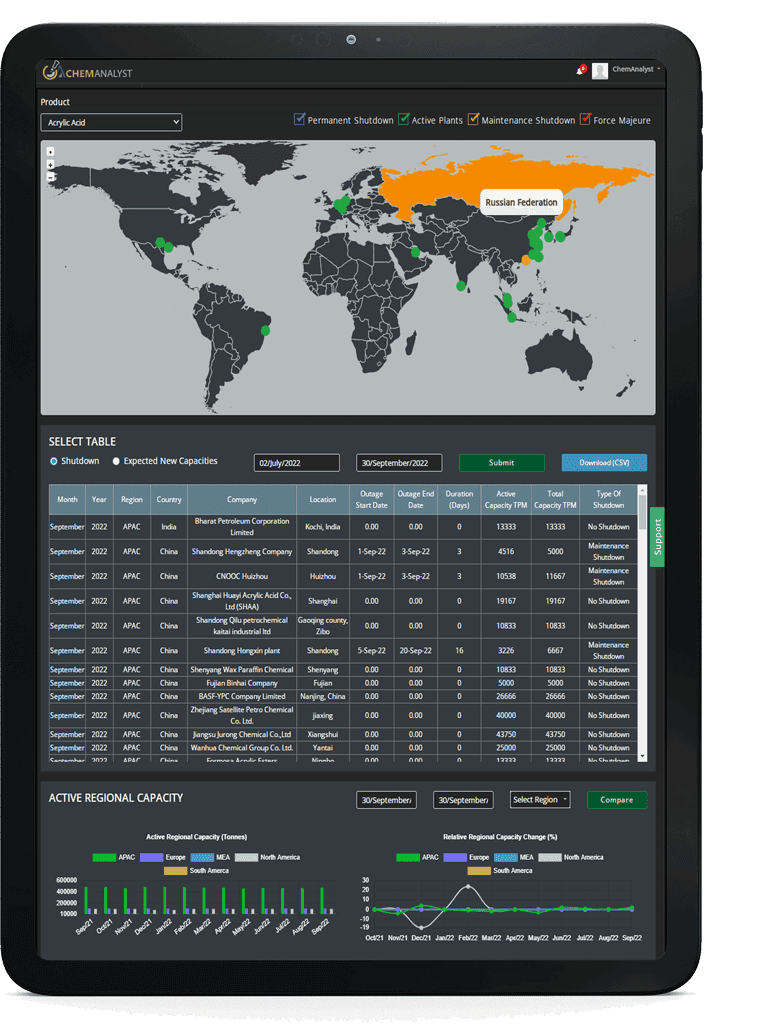
Disruption Tracker
Disruption Tracker reflect the major shutdown on monthly basis which will help you in
tracking the inventory management and smooth functioning of business. Unforeseen shutdowns and disruptions
resulting in a loss of production capacity to impact the bottom line. The capacity tracker provides industries
with a global view of production and consumption capacity loss that reflects the corresponding conversion factors.
It also highlights the immediate impact on supply due to planned and unplanned outages as well as upcoming start-up
of new capacities. Additionally, it emphasizes how each shutdown—whether due to a maintenance turnaround or a case
of force majeure, affects the plant's operating rate for the given duration. Disruption tracker gives a clear insight
into the worldwide outages affecting the commodity of interest. With every shutdown, it also reflects the impact on
supply of the product in the market at a Global level.
Increasing demand of electric vehicles and stronger government support for environment friendly electric vehicles are the major drivers for growth in the demand of e-mobility raw materials.
Asia Pacific holds the major demand share of e-mobility raw materials due increasing demand of the end use industries including automotive. Increasing population and per capita income in emerging economies like India and China is also an influencing factor supporting demand rise in Asia Pacific.
Yes, you will have 24/7 access to the analyst during the subscription period.
Our Solutions
Custom Research
We at ChemAnalyst provide tailor-made solutions to our clients based on their requirements which help them in building and expanding their business by developing customized strategy such as sales strategy, GTM Strategy, product portfolio and new product development. Our dedicated team helps clients in getting the best solution for their requirements. We at ChemAnalyst look forward to serving our clients for long term association.
Techno Economic Feasibility Report (TEFR)
ChemAnalyst provide TEFR reports which include market sizing, plant cost (ISBL and OSBL units), financial modelling, covering all the major financial calculations and ratios including production cost, IRR, major technology, licensing fee (if required), and others fixed and variable costs. TEFR reports will help the client to build greenfield project as well as brownfield expansion for a specific geography. Our Team of experts have delivered multiple TEFR reports which help clients in moving ahead of their business competition by grabbing the opportunity and expanding their business portfolio.
Price Benchmarking
Pricing benchmark report provides real-time data perpetuating current market scenarios, in a world that is changing at a rapid pace, having real-time prices is an imperative to make impactful insights and thereby informed decisions. The Price Benchmarking report provides pricing data for an individual market, or group of markets, which can be converted into localized insights and comparable listings. Benchmarking Reports help clients to make informed decisions by construing the data on several filters: region, country, category, grade and subsequently increasing their brand presence. Clients majorly require pricing benchmarks when they opt for a competitive pricing strategy.
We use cookies to deliver the best possible experience on our website. To learn more, visit our
Privacy Policy.
By continuing to use this site or by closing this box, you consent to our use of cookies.
More info.