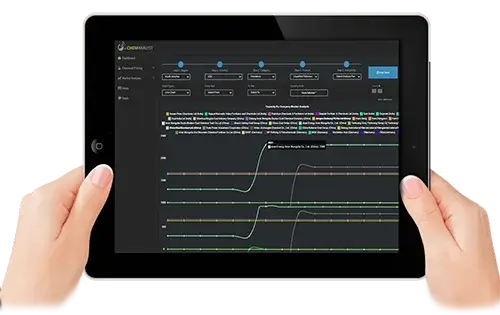
1. Global Polymers Market Outlook, 2015-2030
1.1. Capacity, By Volume
1.1.1.By Region
1.2. Production, By Volume
1.2.1.By Company
1.3. Operating Efficiency
1.3.1.By Company
2. Global Polymers Demand Outlook, 2015-2030, By Volume
2.1. By Application
2.2. By Type
2.3. By Region
2.4. By Company
3. North America Polymers Market Outlook, 2015-2030
3.1. Capacity, By Volume
3.1.1.By Country
3.2. Production
3.2.1.By Country
3.3. Operating Efficiency
3.3.1.By Country
4. North America Polymers Demand Outlook, 2015-2030, By Volume
4.1. By Application
4.2. By Type
4.3. By Country
4.4. United States Polymers Market Outlook, 2015-2030
4.4.1.Capacity, By Volume
4.4.1.1. By Company
4.4.1.2. By Location
4.4.2.Production
4.4.2.1. By Company
4.4.3.Operating Efficiency
4.4.3.1. By Company
4.4.4. United States Polymers Demand-Supply Scenario, 2015-2030, By Volume
4.4.4.1. Demand
4.4.4.2. Supply
4.4.4.3. Gap
4.4.5. United States Polymers Demand Outlook, 2015-2030, By Volume
4.4.5.1. By Application
4.4.5.2. By Type
4.4.5.3. By Company Share (At least top 3 companies’ market share)
4.4.5.4. By Region
4.4.5.5. By Sales Channel
4.5. Mexico Polymers Market Outlook, 2015-2030
4.5.1.Capacity, By Volume
4.5.1.1. By Company
4.5.1.2. By Location
4.5.2.Production
4.5.2.1. By Company
4.5.3.Operating Efficiency
4.5.3.1. By Company
4.5.4. Mexico Polymers Demand-Supply Scenario, 2015-2030, By Volume
4.5.4.1. Demand
4.5.4.2. Supply
4.5.4.3. Gap
4.5.5. Mexico Polymers Demand Outlook, 2015-2030, By Volume
4.5.5.1. By Application
4.5.5.2. By Type
4.5.5.3. By Company Share (At least top 3 companies’ market share)
4.5.5.4. By Region
4.5.5.5. By Sales Channel
4.6. Canada Polymers Market Outlook, 2015-2030
4.6.1.Capacity, By Volume
4.6.1.1. By Company
4.6.1.2. By Location
4.6.2.Production
4.6.2.1. By Company
4.6.3.Operating Efficiency
4.6.3.1. By Company
4.6.4. Canada Polymers Demand-Supply Scenario, 2015-2030, By Volume
4.6.4.1. Demand
4.6.4.2. Supply
4.6.4.3. Gap
4.6.5. Canada Polymers Demand Outlook, 2015-2030, By Volume
4.6.5.1. By Application
4.6.5.2. By Type
4.6.5.3. By Company Share (At least top 3 companies’ market share)
4.6.5.4. By Region
4.6.5.5. By Sales Channel
5. Asia Pacific Polymers Market Outlook, 2015-2030
5.1. Capacity, By Volume
5.1.1.By Country
5.2. Production
5.2.1.By Country
5.3. Operating Efficiency
5.3.1.By Country
6. Asia Pacific Polymers Demand Outlook, 2015-2030, By Volume
6.1. By Application
6.2. By Type
6.3. By Country
6.4. China Polymers Market Outlook, 2015-2030
6.4.1.Capacity, By Volume
6.4.1.1. By Company
6.4.1.2. By Location
6.4.2.Production
6.4.2.1. By Company
6.4.3.Operating Efficiency
6.4.3.1. By Company
6.4.4. China Polymers Demand-Supply Scenario, 2015-2030, By Volume
6.4.4.1. Demand
6.4.4.2. Supply
6.4.4.3. Gap
6.4.5. China Polymers Demand Outlook, 2015-2030, By Volume
6.4.5.1. By Application
6.4.5.2. By Type
6.4.5.3. By Company Share (At least top 3 companies’ market share)
6.4.5.4. By Region
6.4.5.5. By Sales Channel
6.5. India Polymers Market Outlook, 2015-2030
6.5.1.Capacity, By Volume
6.5.1.1. By Company
6.5.1.2. By Location
6.5.2.Production
6.5.2.1. By Company
6.5.3.Operating Efficiency
6.5.3.1. By Company
6.5.4. India Polymers Demand-Supply Scenario, 2015-2030, By Volume
6.5.4.1. Demand
6.5.4.2. Supply
6.5.4.3. Gap
6.5.5. India Polymers Demand Outlook, 2015-2030, By Volume
6.5.5.1. By Application
6.5.5.2. By Type
6.5.5.3. By Company Share (At least top 3 companies’ market share)
6.5.5.4. By Region
6.5.5.5. By Sales Channel
6.6. Japan Polymers Market Outlook, 2015-2030
6.6.1.Capacity, By Volume
6.6.1.1. By Company
6.6.1.2. By Location
6.6.2.Production
6.6.2.1. By Company
6.6.3.Operating Efficiency
6.6.3.1. By Company
6.6.4. Japan Polymers Demand-Supply Scenario, 2015-2030, By Volume
6.6.4.1. Demand
6.6.4.2. Supply
6.6.4.3. Gap
6.6.5. Japan Polymers Demand Outlook, 2015-2030, By Volume
6.6.5.1. By Application
6.6.5.2. By Type
6.6.5.3. By Company Share (At least top 3 companies’ market share)
6.6.5.4. By Region
6.6.5.5. By Sales Channel
6.7. South Korea Polymers Market Outlook, 2015-2030
6.7.1.Capacity, By Volume
6.7.1.1. By Company
6.7.1.2. By Location
6.7.2.Production
6.7.2.1. By Company
6.7.3.Operating Efficiency
6.7.3.1. By Company
6.7.4. South Korea Polymers Demand-Supply Scenario, 2015-2030, By Volume
6.7.4.1. Demand
6.7.4.2. Supply
6.7.4.3. Gap
6.7.5. South Korea Polymers Demand Outlook, 2015-2030, By Volume
6.7.5.1. By Application
6.7.5.2. By Type
6.7.5.3. By Company Share (At least top 3 companies’ market share)
6.7.5.4. By Region
6.7.5.5. By Sales Channel
6.8. Taiwan Polymers Market Outlook, 2015-2030
6.8.1.Capacity, By Volume
6.8.1.1. By Company
6.8.1.2. By Location
6.8.2.Production
6.8.2.1. By Company
6.8.3.Operating Efficiency
6.8.3.1. By Company
6.8.4. Taiwan Polymers Demand-Supply Scenario, 2015-2030, By Volume
6.8.4.1. Demand
6.8.4.2. Supply
6.8.4.3. Gap
6.8.5. Taiwan Polymers Demand Outlook, 2015-2030, By Volume
6.8.5.1. By Application
6.8.5.2. By Type
6.8.5.3. By Region
6.8.5.4. By Sales Channel
6.8.5.5. By Company Share (At least top 3 companies’ market share)
6.9. Singapore Polymers Market Outlook, 2015-2030
6.9.1.Capacity, By Volume
6.9.1.1. By Company
6.9.1.2. By Location
6.9.2.Production
6.9.2.1. By Company
6.9.3.Operating Efficiency
6.9.3.1. By Company
6.9.4. Singapore Polymers Demand-Supply Scenario, 2015-2030, By Volume
6.9.4.1. Demand
6.9.4.2. Supply
6.9.4.3. Gap
6.9.5. Singapore Polymers Demand Outlook, 2015-2030, By Volume
6.9.5.1. By Application
6.9.5.2. By Type
6.9.5.3. By Region
6.9.5.4. By Sales Channel
6.9.5.5. By Company Share (At least top 3 companies’ market share)
7. Europe Polymers Market Outlook, 2015-2030
7.1. Capacity, By Volume
7.1.1.By Country
7.2. Production
7.2.1.By Country
7.3. Operating Efficiency
7.3.1.By Country
8. Europe Polymers Demand Outlook, 2015-2030, By Volume
8.1. By Application
8.2. By Type
8.3. By Sales Channel (Direct/Institutional Sales, Retail Sales, Other Channel Sales)
8.4. By Country
8.5. Germany Polymers Market Outlook, 2015-2030
8.5.1.Capacity, By Volume
8.5.1.1. By Company
8.5.1.2. By Location
8.5.2.Production
8.5.2.1. By Company
8.5.3.Operating Efficiency
8.5.3.1. By Company
8.5.4. Germany Polymers Demand-Supply Scenario, 2015-2030, By Volume
8.5.4.1. Demand
8.5.4.2. Supply
8.5.4.3. Gap
8.5.5. Germany Polymers Demand Outlook, 2015-2030, By Volume
8.5.5.1. By Application
8.5.5.2. By Type
8.5.5.3. By Company Share (At least top 3 companies’ market share)
8.5.5.4. By Region
8.5.5.5. By Sales Channel
8.5.6. Belgium Polymers Market Outlook, 2015-2030
8.5.6.1. Capacity, By Volume
8.5.6.1.1. By Company
8.5.6.1.2. By Location
8.5.6.2. Production
8.5.6.2.1. By Company
8.5.6.3. Operating Efficiency
8.5.6.3.1. By Company
8.5.7. Belgium Polymers Demand-Supply Scenario, 2015-2030, By Volume
8.5.7.1. Demand
8.5.7.2. Supply
8.5.7.3. Gap
8.5.8. Belgium Polymers Demand Outlook, 2015-2030, By Volume
8.5.8.1. By Application
8.5.8.2. By Type
8.5.8.3. By Sales Channel
8.5.8.4. By Company Share (At least top 3 companies’ market share)
8.5.8.5. By Region
8.6. France Polymers Market Outlook, 2015-2030
8.6.1.Capacity, By Volume
8.6.1.1. By Company
8.6.1.2. By Location
8.6.2.Production
8.6.2.1. By Company
8.6.3.Operating Efficiency
8.6.3.1. By Company
8.6.4. France Polymers Demand-Supply Scenario, 2015-2030, By Volume
8.6.4.1. Demand
8.6.4.2. Supply
8.6.4.3. Gap
8.6.5. France Polymers Demand Outlook, 2015-2030, By Volume
8.6.5.1. By Application
8.6.5.2. By Type
8.6.5.3. By Sales Channel
8.6.5.4. By Company Share (At least top 3 companies’ market share)
8.6.5.5. By Region
8.7. United Kingdom Polymers Market Outlook, 2015-2030
8.7.1.Capacity, By Volume
8.7.1.1. By Company
8.7.1.2. By Location
8.7.2.Production
8.7.2.1. By Company
8.7.3.Operating Efficiency
8.7.3.1. By Company
8.7.4. United Kingdom Polymers Demand-Supply Scenario, 2015-2030, By Volume
8.7.4.1. Demand
8.7.4.2. Supply
8.7.4.3. Gap
8.7.5. United Kingdom Polymers Demand Outlook, 2015-2030, By Volume
8.7.5.1. By Application
8.7.5.2. By Type
8.7.5.3. By Sales Channel
8.7.5.4. By Company Share (At least top 3 companies’ market share)
8.7.5.5. By Region
8.8. Spain Polymers Market Outlook, 2015-2030
8.8.1.Capacity, By Volume
8.8.1.1. By Company
8.8.1.2. By Location
8.8.2.Production
8.8.2.1. By Company
8.8.3.Operating Efficiency
8.8.3.1. By Company
8.8.4. Spain Polymers Demand-Supply Scenario, 2015-2030, By Volume
8.8.4.1. Demand
8.8.4.2. Supply
8.8.4.3. Gap
8.8.5. Spain Polymers Demand Outlook, 2015-2030, By Volume
8.8.5.1. By Application
8.8.5.2. By Type
8.8.5.3. By Sales Channel
8.8.5.4. By Company Share (At least top 3 companies’ market share)
8.8.5.5. By Region
8.9. Italy Polymers Market Outlook, 2015-2030
8.9.1.Capacity, By Volume
8.9.1.1. By Company
8.9.1.2. By Location
8.9.2.Production
8.9.2.1. By Company
8.9.3.Operating Efficiency
8.9.3.1. By Company
8.9.4. Italy Polymers Demand-Supply Scenario, 2015-2030, By Volume
8.9.4.1. Demand
8.9.4.2. Supply
8.9.4.3. Gap
8.9.5. Italy Polymers Demand Outlook, 2015-2030, By Volume
8.9.5.1. By Application
8.9.5.2. By Type
8.9.5.3. By Sales Channel
8.9.5.4. By Company Share (At least top 3 companies’ market share)
8.9.5.5. By Region
8.10. Sweden Polymers Market Outlook, 2015-2030
8.10.1. Capacity, By Volume
8.10.1.1. By Company
8.10.1.2. By Location
8.10.2. Production
8.10.2.1. By Company
8.10.3. Operating Efficiency
8.10.3.1. By Company
8.10.4. Sweden Polymers Demand-Supply Scenario, 2015-2030, By Volume
8.10.4.1. Demand
8.10.4.2. Supply
8.10.4.3. Gap
8.10.5. Sweden Polymers Demand Outlook, 2015-2030, By Volume
8.10.5.1. By Application
8.10.5.2. By Type
8.10.5.3. By Sales Channel
8.10.5.4. By Company Share (At least top 3 companies’ market share)
8.10.5.5. By Region
8.11. Austria Polymers Market Outlook, 2015-2030
8.11.1. Capacity, By Volume
8.11.1.1. By Company
8.11.1.2. By Location
8.11.2. Production
8.11.2.1. By Company
8.11.3. Operating Efficiency
8.11.3.1. By Company
8.11.4. Austria Polymers Demand-Supply Scenario, 2015-2030, By Volume
8.11.4.1. Demand
8.11.4.2. Supply
8.11.4.3. Gap
8.11.5. Austria Polymers Demand Outlook, 2015-2030, By Volume
8.11.5.1. By Application
8.11.5.2. By Type
8.11.5.3. By Sales Channel
8.11.5.4. By Company Share (At least top 3 companies’ market share)
8.11.5.5. By Region
9. MEA Polymers Market Outlook, 2015-2030
9.1. Capacity, By Volume
9.1.1.By Country
9.2. Production
9.2.1.By Country
9.3. Operating Efficiency
9.3.1.By Country
10. MEA Polymers Demand Outlook, 2015-2030, By Volume
10.1. By Application
10.2. By Type
10.3. By Sales Channel
10.4. By Country
10.5. Saudi Arabia Polymers Market Outlook, 2015-2030
10.5.1. Capacity, By Volume
10.5.1.1. By Company
10.5.1.2. By Location
10.5.2. Production
10.5.2.1. By Company
10.5.3. Operating Efficiency
10.5.3.1. By Company
10.5.4. Saudi Arabia Polymers Demand-Supply Scenario, 2015-2030, By Volume
10.5.4.1. Demand
10.5.4.2. Supply
10.5.4.3. Gap
10.5.5. Saudi Arabia Polymers Demand Outlook, 2015-2030, By Volume
10.5.5.1. By Application
10.5.5.2. By Type
10.5.5.3. By Sales Channel
10.5.5.4. By Company Share (At least top 3 companies’ market share)
10.5.5.5. By Region
10.6. Iran Polymers Market Outlook, 2015-2030
10.6.1. Capacity, By Volume
10.6.1.1. By Company
10.6.1.2. By Location
10.6.2. Production
10.6.2.1. By Company
10.6.3. Operating Efficiency
10.6.3.1. By Company
10.6.4. Iran Polymers Demand-Supply Scenario, 2015-2030, By Volume
10.6.4.1. Demand
10.6.4.2. Supply
10.6.4.3. Gap
10.6.5. Iran Polymers Demand Outlook, 2015-2030, By Volume
10.6.5.1. By Application
10.6.5.2. By Type
10.6.5.3. By Sales Channel
10.6.5.4. By Company Share (At least top 3 companies’ market share)
10.6.5.5. By Region
10.7. South Africa Polymers Market Outlook, 2015-2030
10.7.1. Capacity, By Volume
10.7.1.1. By Company
10.7.1.2. By Location
10.7.2. Production
10.7.2.1. By Company
10.7.3. Operating Efficiency
10.7.3.1. By Company
10.7.4. South Africa Polymers Demand-Supply Scenario, 2015-2030, By Volume
10.7.4.1. Demand
10.7.4.2. Supply
10.7.4.3. Gap
10.7.5. South Africa Polymers Demand Outlook, 2015-2030, By Volume
10.7.5.1. By Application
10.7.5.2. By Type
10.7.5.3. By Sales Channel
10.7.5.4. By Company Share (At least top 3 companies’ market share)
10.7.5.5. By Region
11. South America Polymers Market Outlook, 2015-2030
11.1. Capacity, By Volume
11.1.1. By Country
11.2. Production
11.2.1. By Country
11.3. Operating Efficiency
11.3.1. By Country
12. South America Polymers Demand Outlook, 2015-2030, By Volume
12.1. By Application
12.2. By Type
12.3. By Sales Channel (Direct/Institutional Sales, Retail Sales, Other Channel Sales)
12.4. By Company Share (At least top 3 companies’ market share)
12.5. By Country
12.6. Brazil Polymers Market Outlook, 2015-2030
12.6.1. Capacity, By Volume
12.6.1.1. By Company
12.6.1.2. By Location
12.6.2. Production
12.6.2.1. By Company
12.6.3. Operating Efficiency
12.6.3.1. By Company
12.6.4. Brazil Polymers Demand-Supply Scenario, 2015-2030, By Volume
12.6.4.1. Demand
12.6.4.2. Supply
12.6.4.3. Gap
12.6.5. Brazil Polymers Demand Outlook, 2015-2030, By Volume
12.6.5.1. By Application
12.6.5.2. By Type
12.6.5.3. By Sales Channel
12.6.5.4. By Company Share (At least top 3 companies’ market share)
12.6.5.5. By Region
12.7. Argentina Polymers Market Outlook, 2015-2030
12.7.1. Capacity, By Volume
12.7.1.1. By Company
12.7.1.2. By Location
12.7.2. Production
12.7.2.1. By Company
12.7.3. Operating Efficiency
12.7.3.1. By Company
12.7.4. Argentina Polymers Demand-Supply Scenario, 2015-2030, By Volume
12.7.4.1. Demand
12.7.4.2. Supply
12.7.4.3. Gap
12.7.5. Argentina Polymers Demand Outlook, 2015-2030, By Volume
12.7.5.1. By Application
12.7.5.2. By Type
12.7.5.3. By Sales Channel
12.7.5.4. By Company Share (At least top 3 companies’ market share)
13. By Region
14. Country-wise Import
15. Country-wise Export
16. News and Deals
Lorem Ipsum is simply dummy text of the printing and typesetting industry. Lorem Ipsum has been the industry's standard dummy text ever since the 1500s,Lorem Ipsum has been the industry's standard dummy text ever since the 1500s,