|
Installed Capacity By Company
|
Installed capacity at a regional level along with the individual capacity of leading players
|
|
Installed Capacity By Location
|
Installed capacity at country level
|
|
Installed Capacity By Process
|
Installed capacity by different processes
|
|
Installed Capacity By Technology
|
Installed capacity by different technologies being used to produce Reverse Osmosis Membrane
|
|
Production By Company
|
Actual production done by different companies
|
|
Operating Efficiency By Company
|
Operating efficiency at which different companies are operating their plants
|
|
Demand By End Use
|
Demand/Sale of Reverse Osmosis Membrane in different end-user industries across the region
|
|
Demand By Sales Channel
|
Demand/Sale of Reverse Osmosis Membrane by different sales channels across the region
|
|
Demand By Region
|
Demand/Sale of Reverse Osmosis Membrane in different regions of the country
|
|
Foreign Trade Country-wise
|
Foreign trade by each country
|
|
Demand & Supply Gap
|
Demand & Supply Gap at country level
|
|
Company Share
|
Revenue shares of leading players in the country
|
I am satisfied with overall performance of ChemAnalyst. Weekly updates before the final report were especially helpful and reassuring. Additional requests on the interim and/or final reports were handled in a swift and professional manner
Mr.Shin Dosho
Member - Board of Directors
Osaka Gas Co. Ltd
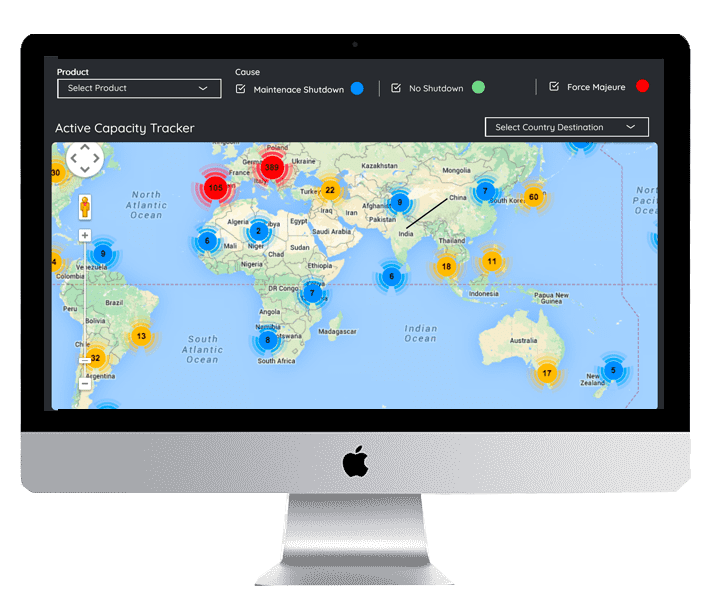
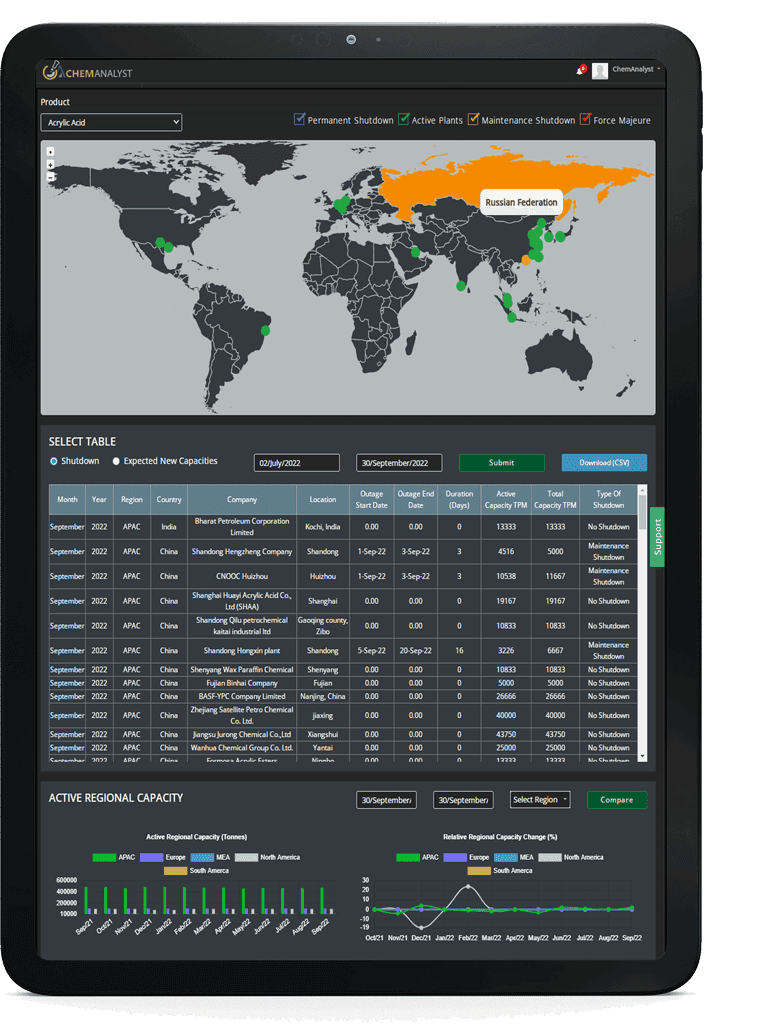
Disruption Tracker reflect the major shutdown on monthly basis which will help you in tracking the inventory management and smooth functioning of business. Unforeseen shutdowns and disruptions resulting in a loss of production capacity to impact the bottom line. The capacity tracker provides industries with a global view of production and consumption capacity loss that reflects the corresponding conversion factors. It also highlights the immediate impact on supply due to planned and unplanned outages as well as upcoming start-up of new capacities. Additionally, it emphasizes how each shutdown—whether due to a maintenance turnaround or a case of force majeure, affects the plant's operating rate for the given duration. Disruption tracker gives a clear insight into the worldwide outages affecting the commodity of interest. With every shutdown, it also reflects the impact on supply of the product in the market at a Global level.
We at ChemAnalyst provide tailor-made solutions to our clients based on their requirements which help them in building and expanding their business by developing customized strategy such as sales strategy, GTM Strategy, product portfolio and new product development. Our dedicated team helps clients in getting the best solution for their requirements. We at ChemAnalyst look forward to serving our clients for long term association.
ChemAnalyst provide TEFR reports which include market sizing, plant cost (ISBL and OSBL units), financial modelling, covering all the major financial calculations and ratios including production cost, IRR, major technology, licensing fee (if required), and others fixed and variable costs. TEFR reports will help the client to build greenfield project as well as brownfield expansion for a specific geography. Our Team of experts have delivered multiple TEFR reports which help clients in moving ahead of their business competition by grabbing the opportunity and expanding their business portfolio.
Pricing benchmark report provides real-time data perpetuating current market scenarios, in a world that is changing at a rapid pace, having real-time prices is an imperative to make impactful insights and thereby informed decisions. The Price Benchmarking report provides pricing data for an individual market, or group of markets, which can be converted into localized insights and comparable listings. Benchmarking Reports help clients to make informed decisions by construing the data on several filters: region, country, category, grade and subsequently increasing their brand presence. Clients majorly require pricing benchmarks when they opt for a competitive pricing strategy.